The 50 Hz sidebands at 0.75 Hz are modelled by the bilinear coupling of ENV_CEB_UPS_VOLT_R_2000Hz and ASC_DIFFp_TX, as visible in the daily MONET results of May 2. The modulator ASC_COMMp_TX produces interesting structures too, although just below the default coherence threshold set on the daily MONET analysis.


Following #63996 and #64130, this is the usual update on spectral line monitoring for weeks 3 and 4 of O4b. Selected time intervals have been:
week 3: 2024-04-28 19:16:48 - 2024-04-30 06:01:53 (125105.0 sec)
week 4: 2024-05-04 21:06:08 to 2024-05-06 15:35:07 (152939.0 sec)
In the attachment, the PDFs with the various regions of the spectrum and the identified lines, and the CSVs (converted to TXT extension) with the frequencies of the lines and their log-prominences.
I'm repeating the analysis described in #63996 for the second week of O4b. The selected data segment is: 2024-04-20 22:14:40 to 2024-04-21 18:30:12 (72932.0 sec).
As before, I attach the CSV with the identified frequencies and the PDF with the various regions of the spectrum.

I have run a cross-correlation analysis using deltas for each glitch time, and all the _mean and _rms channels from the trend frame. I confirm what was highlighted by Bas in the previous comment:
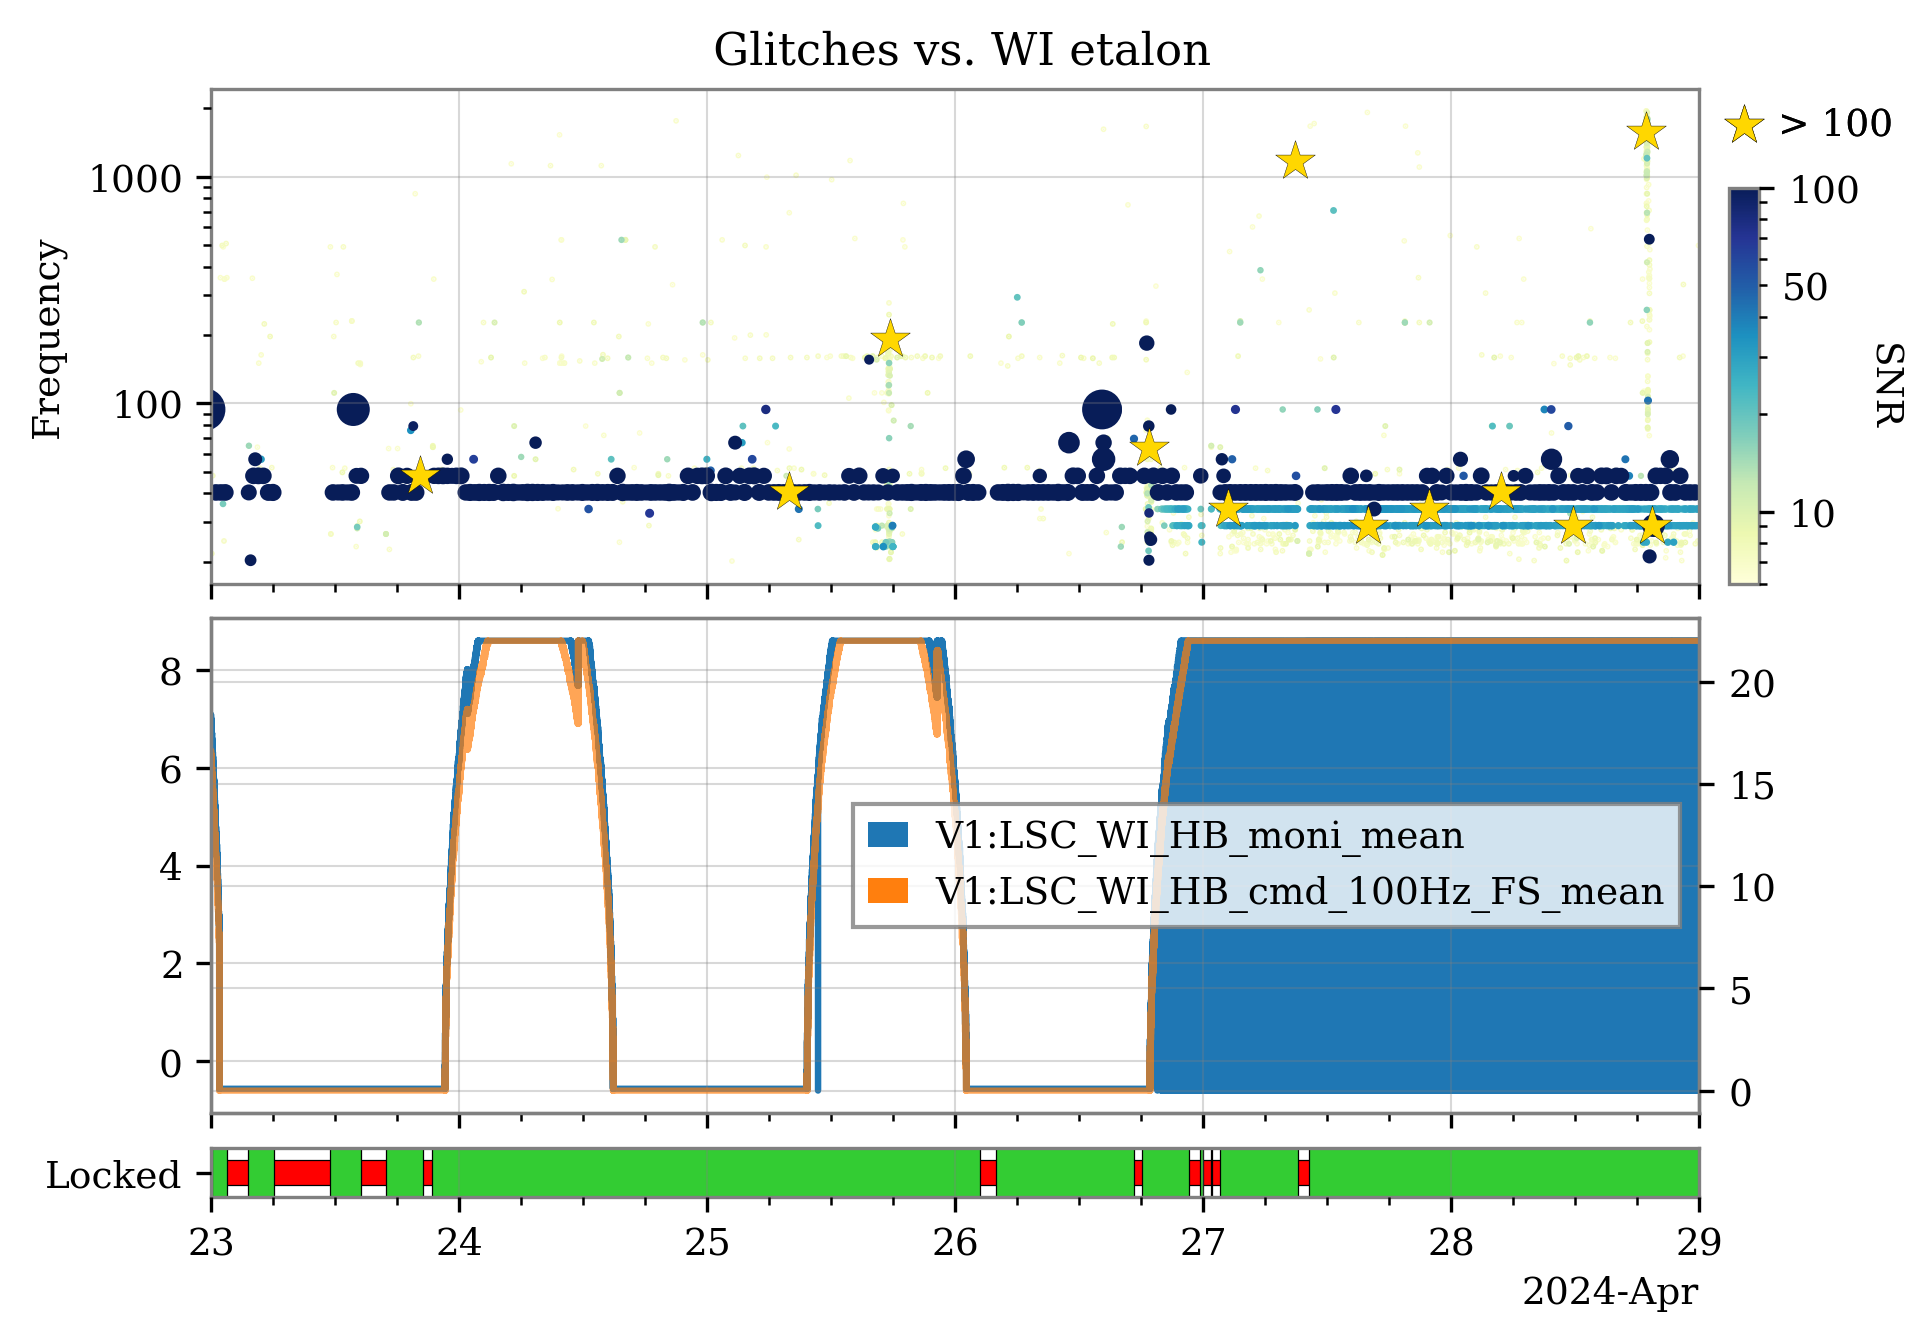
1) Since April 26 20:00 UTC, the LSC_WI_HB_moni channel has started behaving oddly, with a sequence of square waves from zero to the set point. This is simultaneous with the appearance of the new glitches. The channel monitoring the electric potential, LSC_WI_HB_cmd_100Hz_FS, doesn't present similar behaviour. Figure 1 shows the glitchgram, with the new glitches showing up at the end of Apr 26, and the time series of the two channels monitoring the WI etalon.
2) The glitches in hrec are synchronous with the steps in the square wave visible in LSC_WI_HB_moni.
3) The correlation analysis with the _rms and the _mean trend channels has produced no other correlated channel with these glitches.


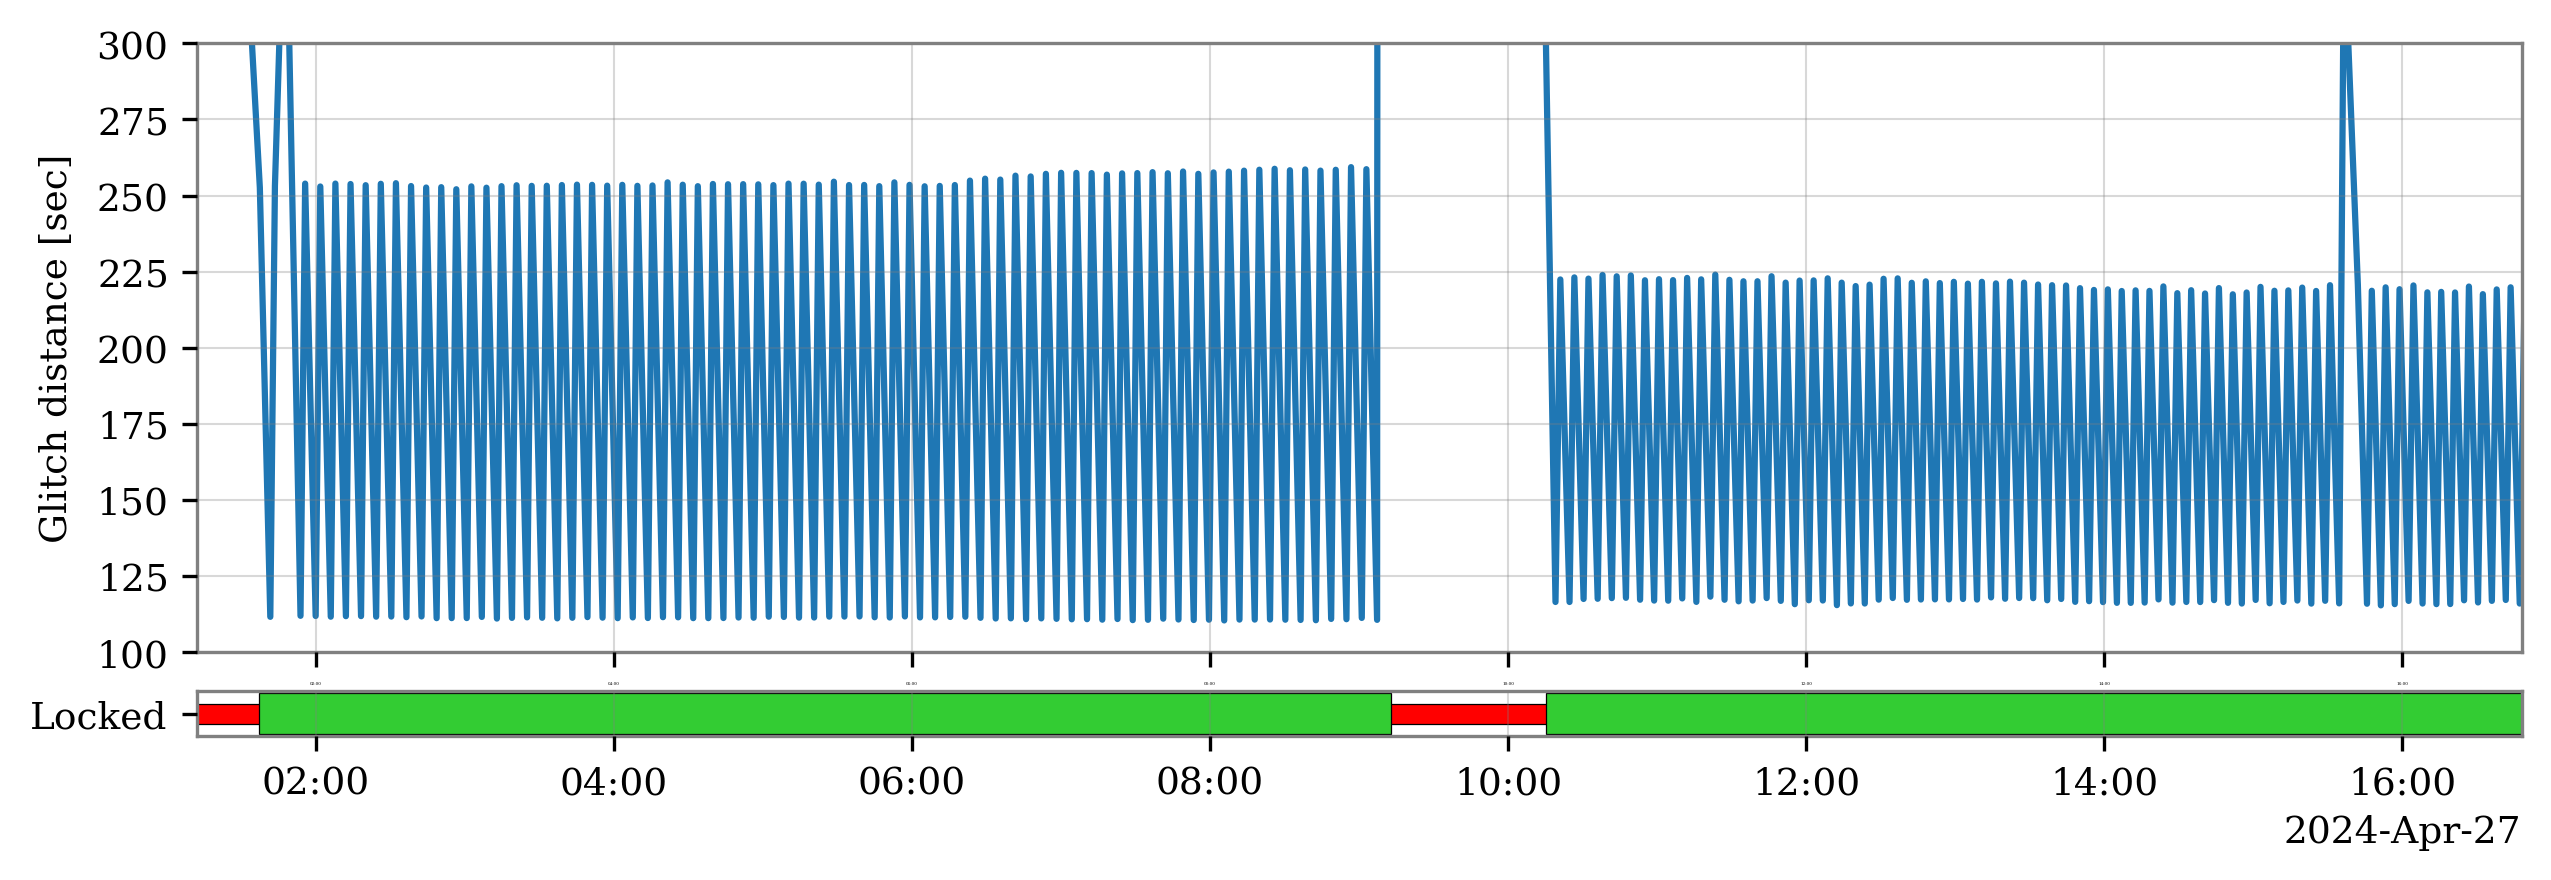
These new glitches seem to originate from some noise source activating for ~2 minutes and off for ~4, similar to a square wave.
First of all, I identified the new glitch family selecting the omicron triggers with peak frequency lower than 40 Hz and SNR between 15 and 60. Then, plotting the temporal distances in the occurrences of consecutive glitches (similarly to what has been done for the 25-minute glitches), I noticed that these alternate between ~115 seconds and 250 or 225 seconds in the examined time interval: figure 1.
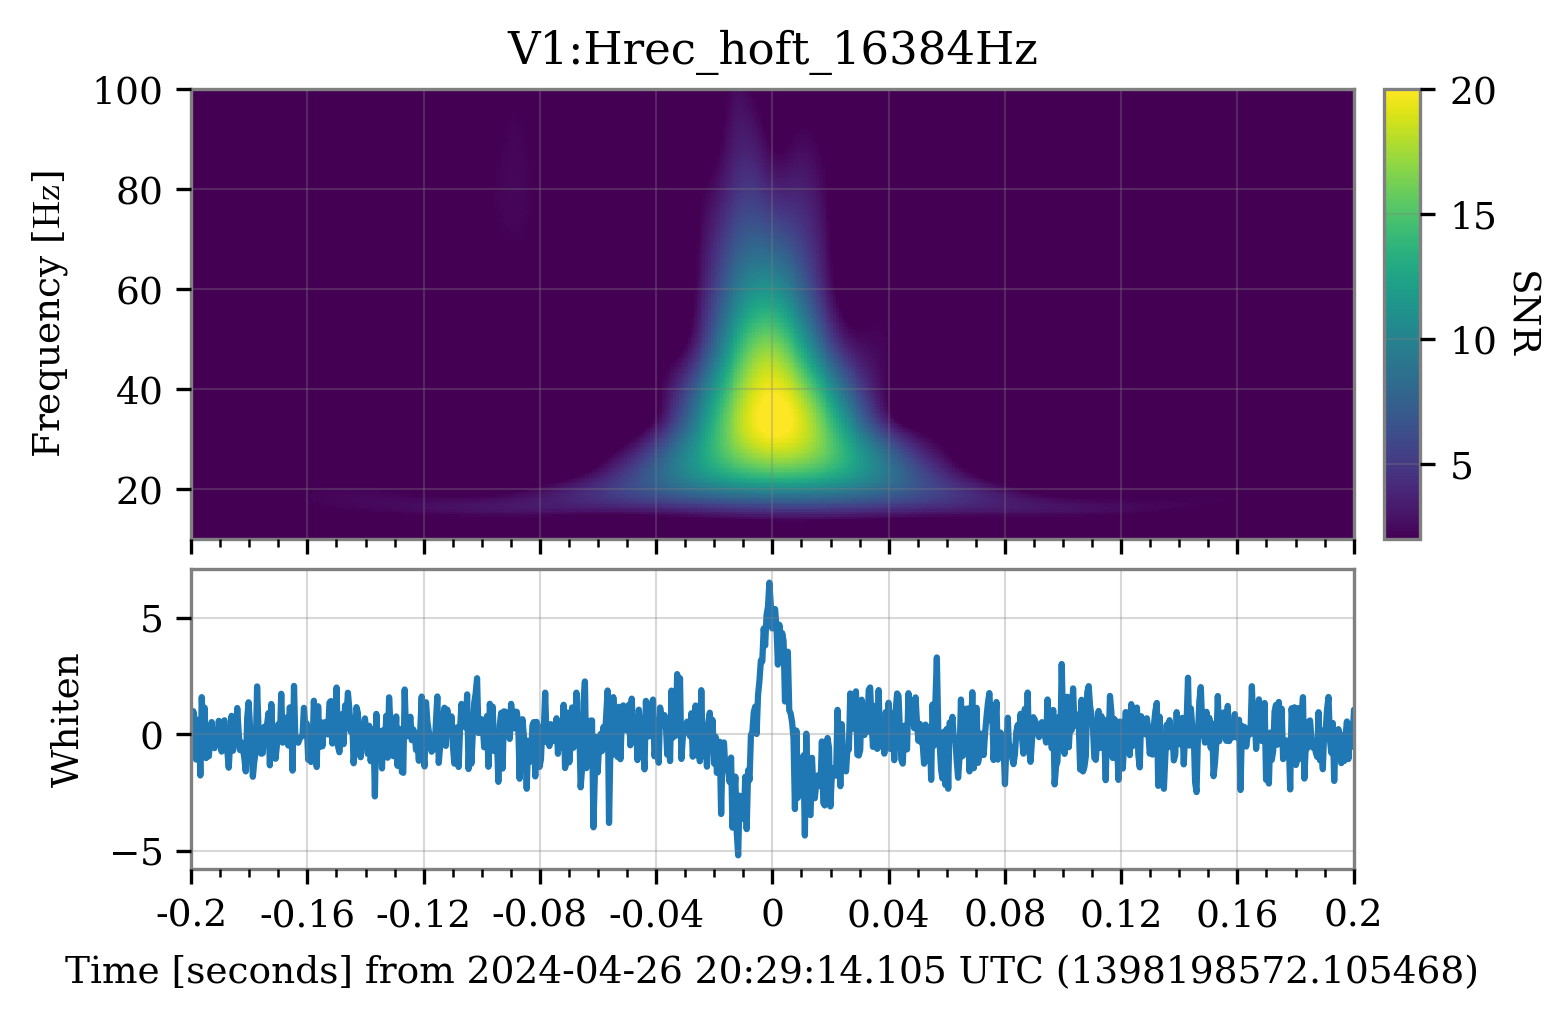
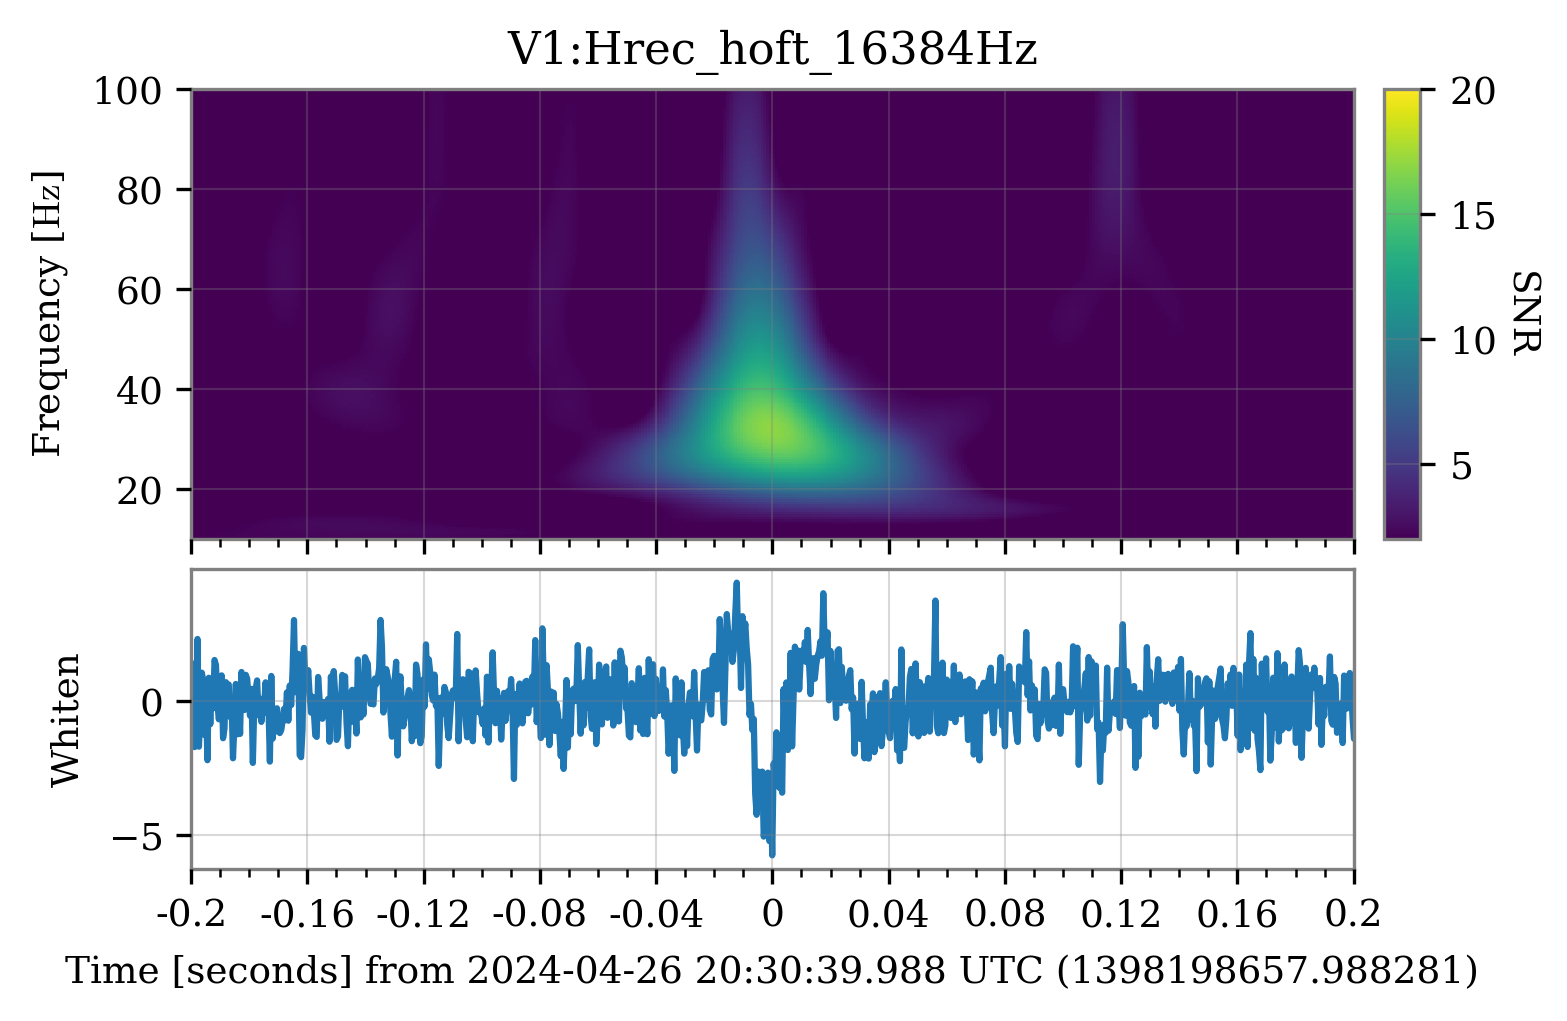
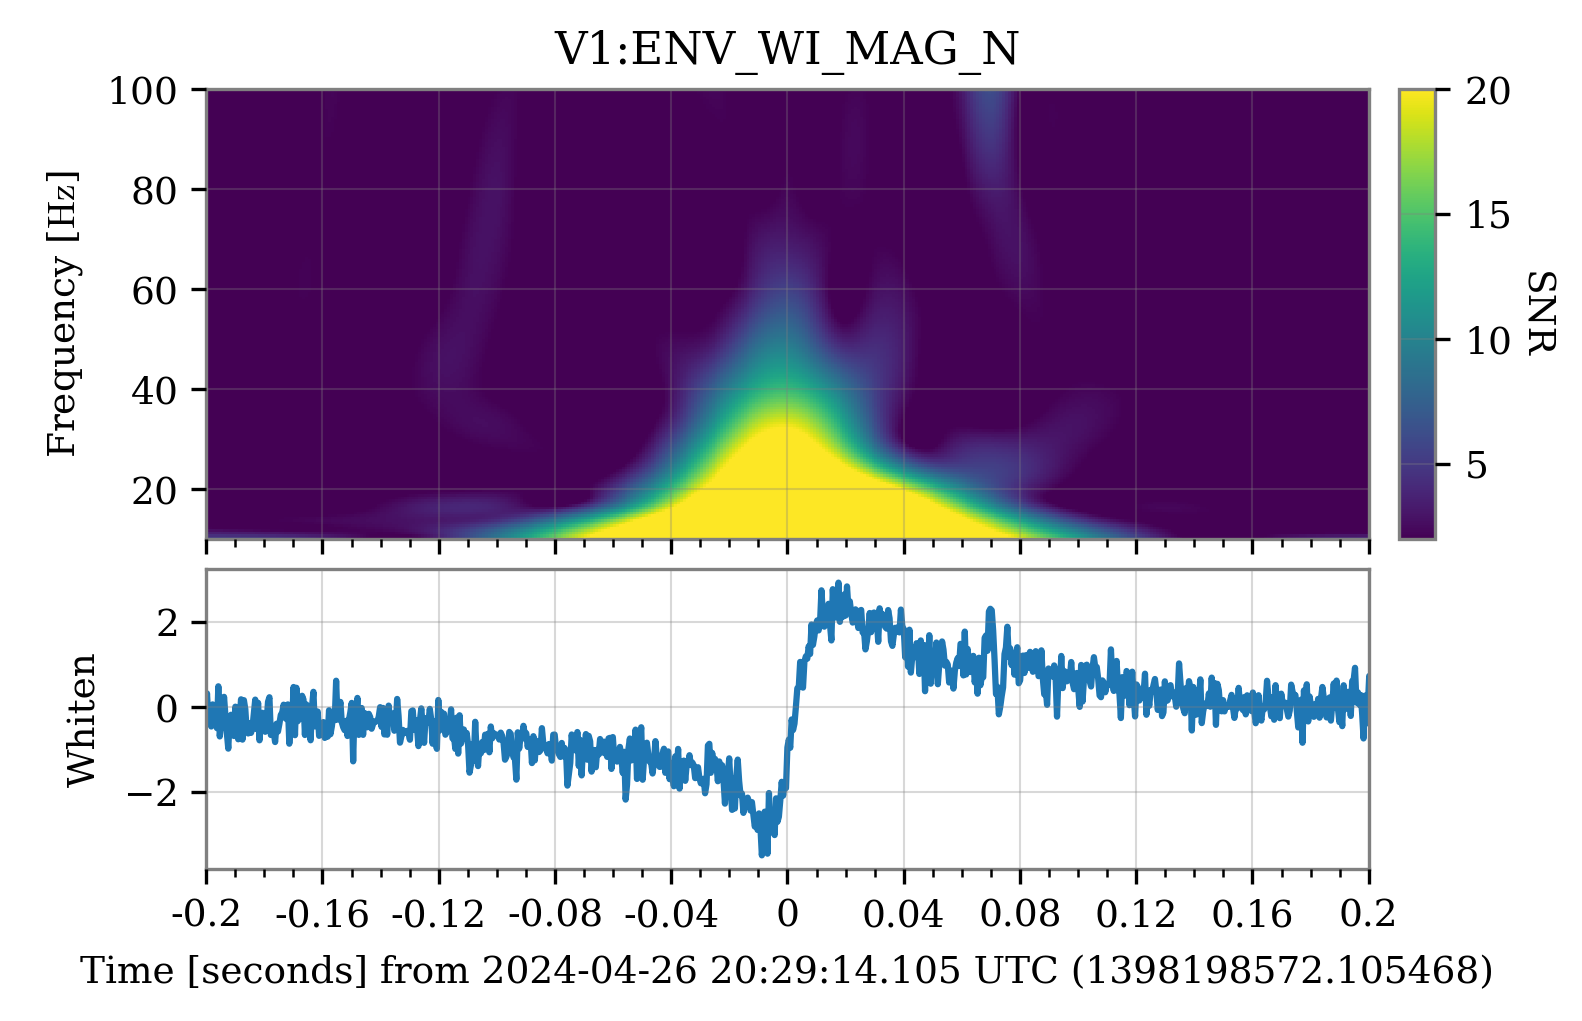
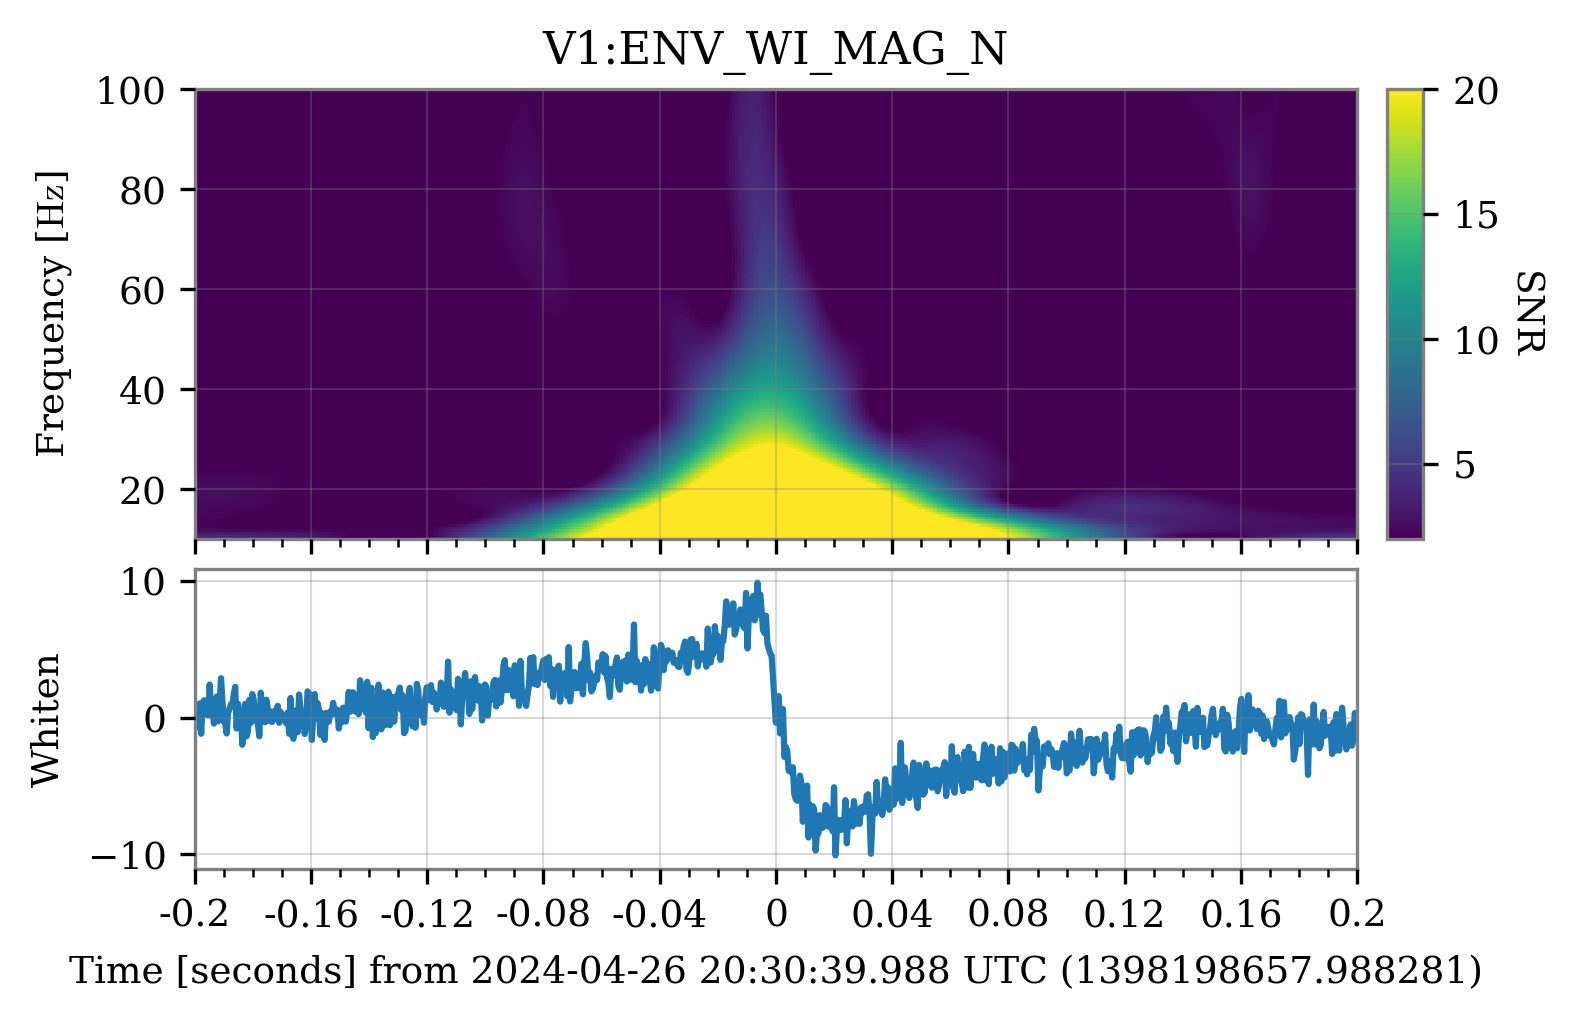
Figure 2 and 3 show the spectrograms of two consecutive glitches in hrec, and their whiten time series. The latter show opposite behaviours, with a spike up in one glitch, followed by a spike down in the next one.
Similar plots for the magnetometers at the West Input, show a step-like behaviour: figure 4 and 5.
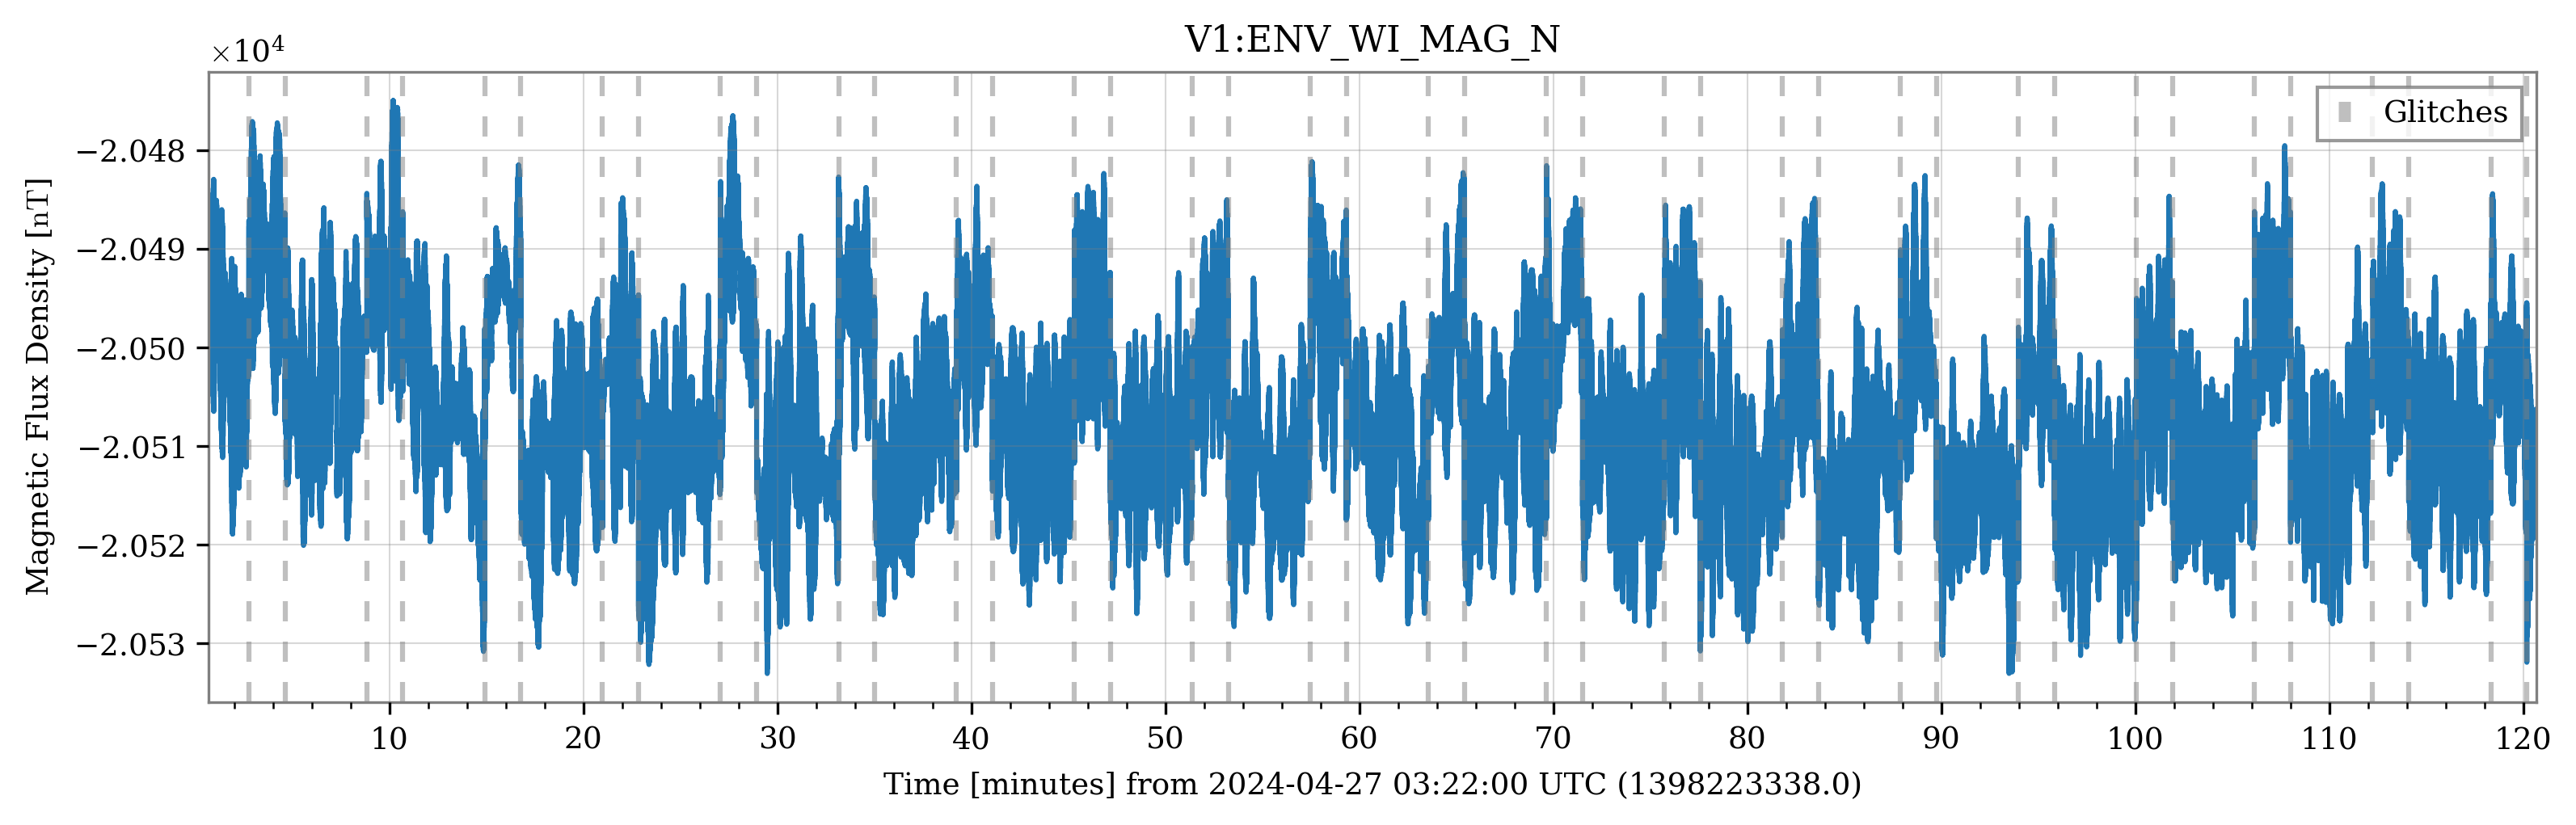
The (non-whitened) time series of this magnetometer channel shows more clearly the square wave behaviour in the correspondence of each pair of glitches: figure 6.
The next task is finding what source is activating with a similar timing.


A new noise is seen in the external magnetometer starting April 22 19:56 UTC. Figures 1 and 2. The noise has been detected and studied by Renato and Federico. Here is a report of the investigation so far.
The noise is impulsive, as seen in Figures 3,4,5. Observed in the time domain it consists of a carrier at about 8Hz switching on-off with a cycle of approximately 4.4s (0.23 Hz): on for 2.2s and off for 2.2s.
The noise is seen by all magnetometers site-wide. Internal magnetometers sees it a factor up to about 10 larger than the external "N" magnetometer, in Figure 6 and Figure 7 (the EXT_N magnetometer is the gray spectrum in all 3 plots). Magnetometers that see it a bit more intense are those close to NI, WI and WE towers.
A close look to the narrow spectral structure of the noise shows that it does not follow the mains, in Figure 8.
These hints suggest a DC-powered PWM source (Federico).
Bruco runs using ENV_NI_MAG_V as target, and EXCLUDING all magnetometers (ENV_*MAG*) channels, show that this disturbance is not coherent with any other ENV channel (https://scientists.virgo-gw.eu/DataAnalysis/DetCharDev/bruco/users/fiori/ENV_NI_MAG_V_1397853318_ENV/) with the exception of a small coherence with the ENV_CEB_ELECTRIC. In particular no coherence, nor evidence of the noise is seen in all IPS and UPS probes. No coherence is also measured with any other Virgo signal (https://scientists.virgo-gw.eu/DataAnalysis/DetCharDev/bruco/users/fiori/ENV_NI_MAG_V_1397853318/). While s is a good news for the interferometer, it does not help much locating the source.
Measurements will be done also to check for possible external sources, like it was for galvanic currents in the natural gas pipelines (https://logbook.virgo-gw.eu/virgo/?r=55542).


We performed some measurements with a portable magnetometer: 3-axial magnetic probe FL3 100 Stefan Mayer.
Figure 1 compares spectra recorded in two locations:
- "EXTMAG chs X,Y,Z" the probe was placed on the soil nearby the buried external magnetometer
- "GUARD3 chs X,Y,Z" the probe was on the soil next to the vent tube of the methan gas pipeline, this is located inside the EGO fence next the EGO guardiania, see the attached pictures.
The GUARD3 spectra clearly show the noise: 0.23 Hz spaced lines peaking at 8Hz. The peak amplitude (spectra are obtained with 25s window) is approx 2 nT/sqrtHz. Which is a factor approx 100 larger than measured in the location EXTMAG, but similar to that measured by the magnetometers on the NI and WI tower base. Might be due to telluric currents in the chambers?
As a check of the probe calibration, in Figures 2 and 3 we compare the EXTMAG measurement with that of the buried magnetometer, ENV_EXT_MAG_N. The fluxgate probe is more noisy (intrinsic noise) but around 8Hz they are measuring the same.
The indication is that the magnetic disturbance is radiated from the methan gas pipelines. A noise clearly associated to the power supply for galvanic currents in these pipelines was observed in the year 2022 (55542 and 57973). At that time the noise was shaped as approx. 5Hz comb.
Federico has contacted the methan gas company (SNAM) to investigate further the source.


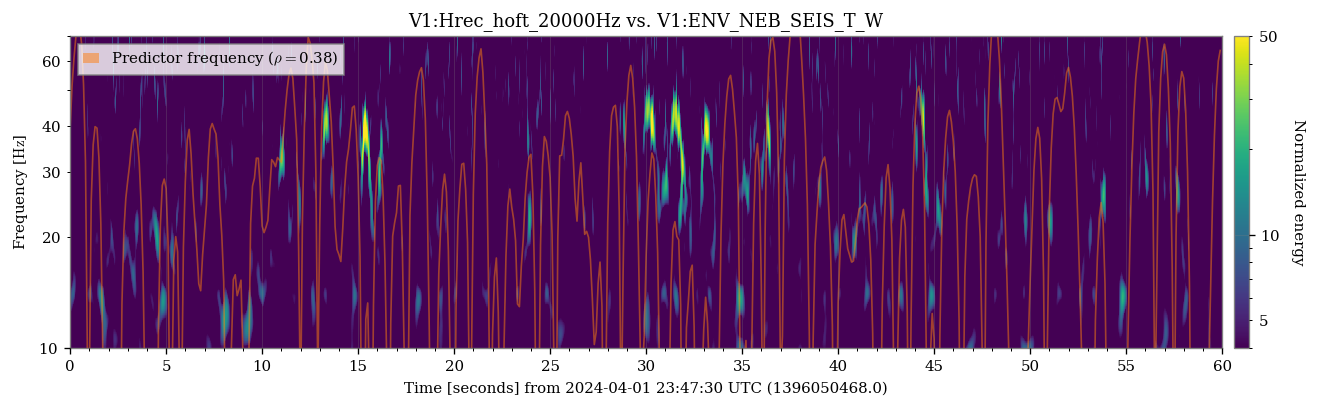
I have refined the analysis in the main entry to include more glitches and all the auxiliary channels measuring positions, velocities and accelerations, as described in this git issue. The results are contained in the attached text files. These confirm and expand what is already presented in the main entry, that is, a strong correlation of these glitches with the movement of the West End bench and suspension. Correlations with velocity and acceleration sensors are instead much smaller. They tend to point to the motion of parts of the North End building, but plotting the predictor frequencies superimposed to the spectrogram of Hrec shows in fact no convincing correlations. Example in figure 1.

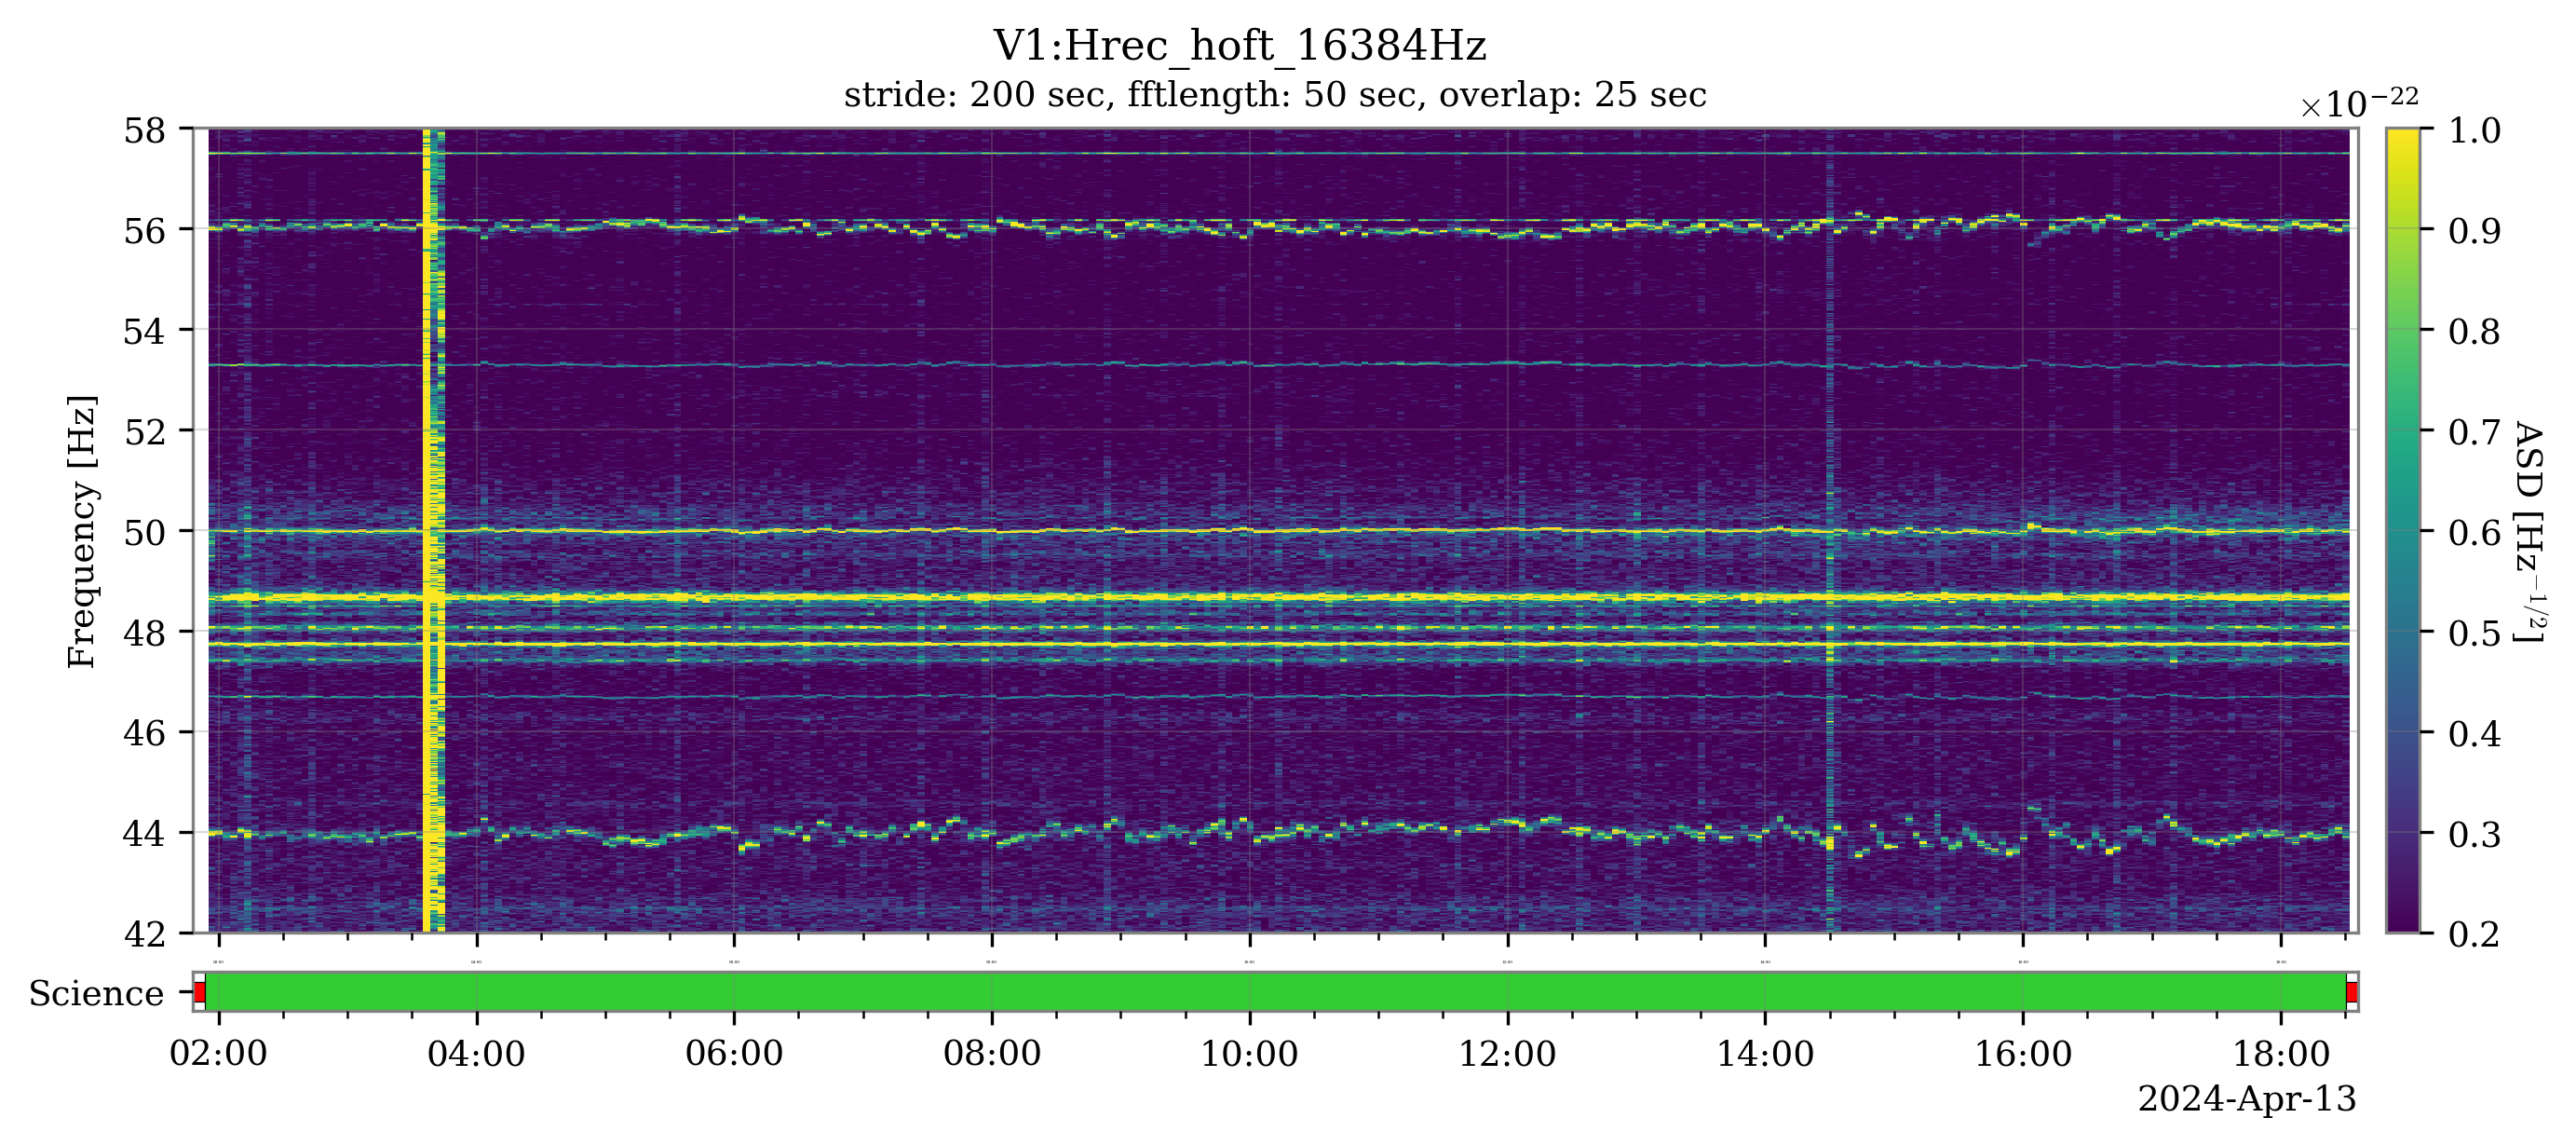
ERRATA CORRIGE: the sidebands at 44 and 56 Hz are non-physical. These are just an aliasing artefact, consequence of an improper chunk-by-chunk downsampling to produce the resulting spectrogram.
Figure 1: fixed version of the spectrogram in the range 42-58 Hz.
Figure 2: animated GIF that compares the correct spectrogram and the wrong one in the main entry.


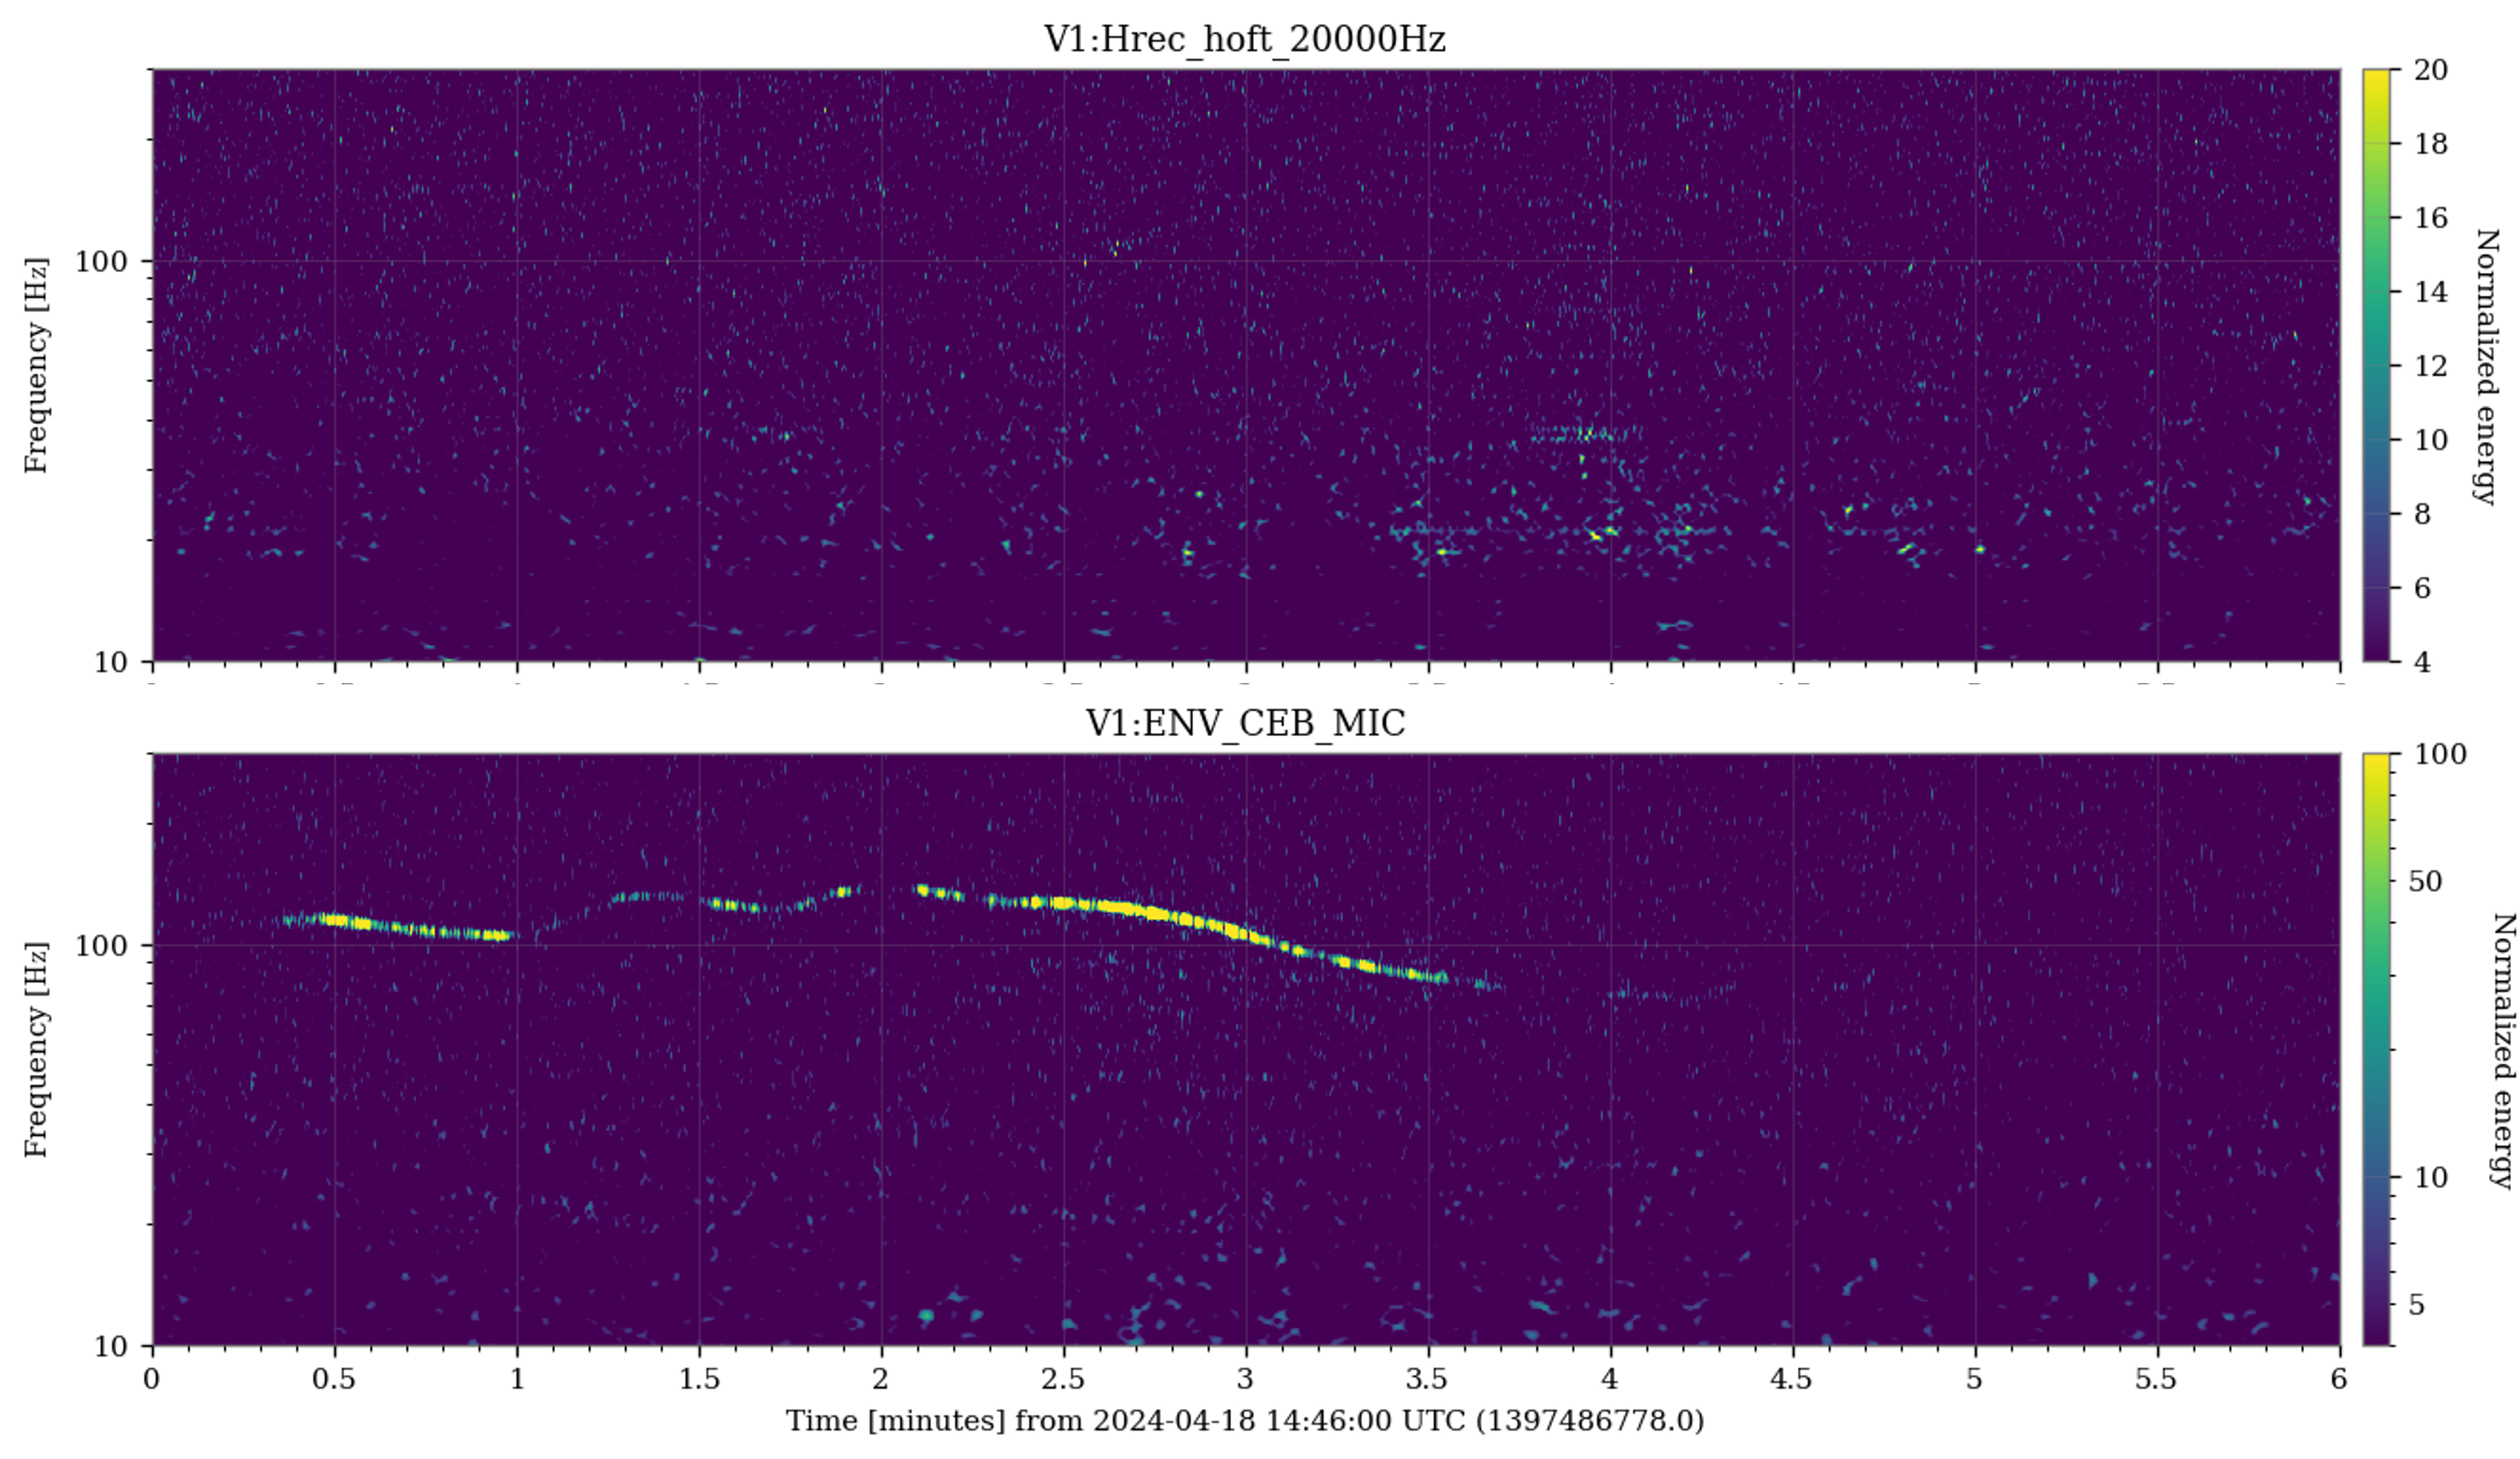
I've checked with some Q-scans if the transit of the helicopter caused glitches in Hrec.
Figure 1: During the first transit at 14:46 UTC no excess noise was visible in Hrec, while in the CEB microphone is clearly visible the sweep caused by the helicopter.
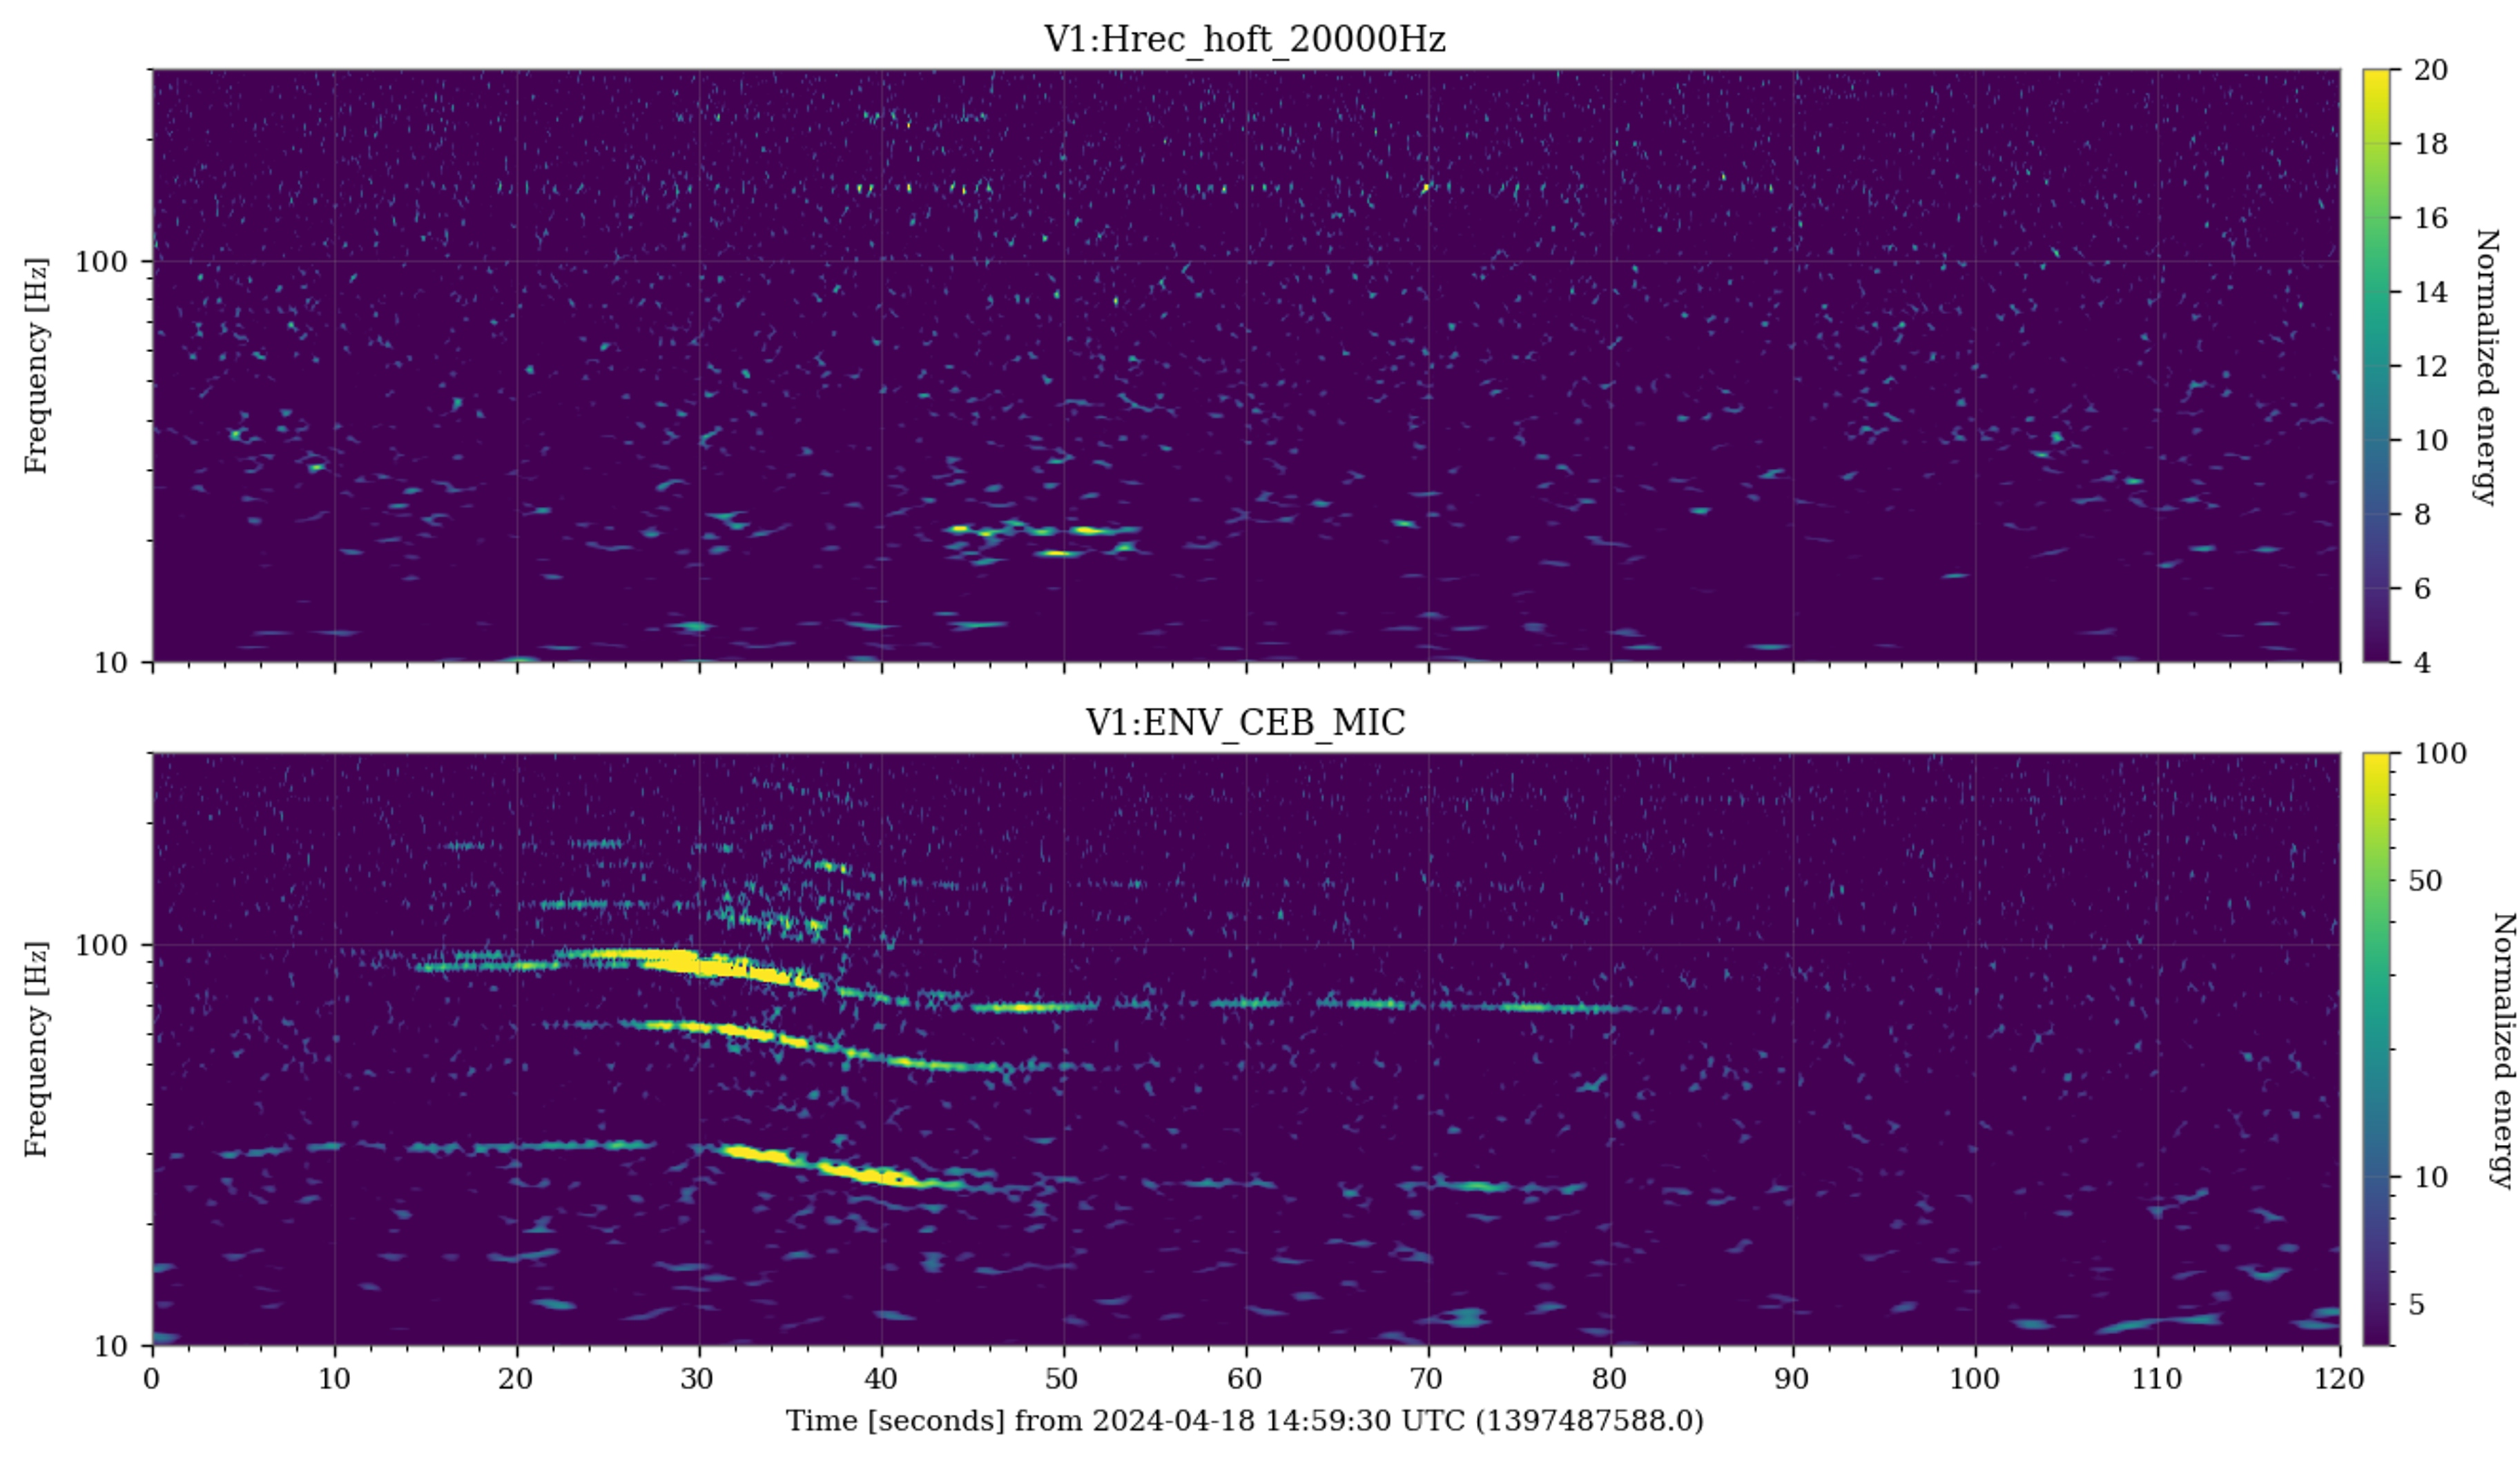
Figure 2: during the transit at 14:59 UTC some barely coincident noise is visible in Hrec and the CEB microphone. The frequency is not exactly the same, so this may have just happened by chance.
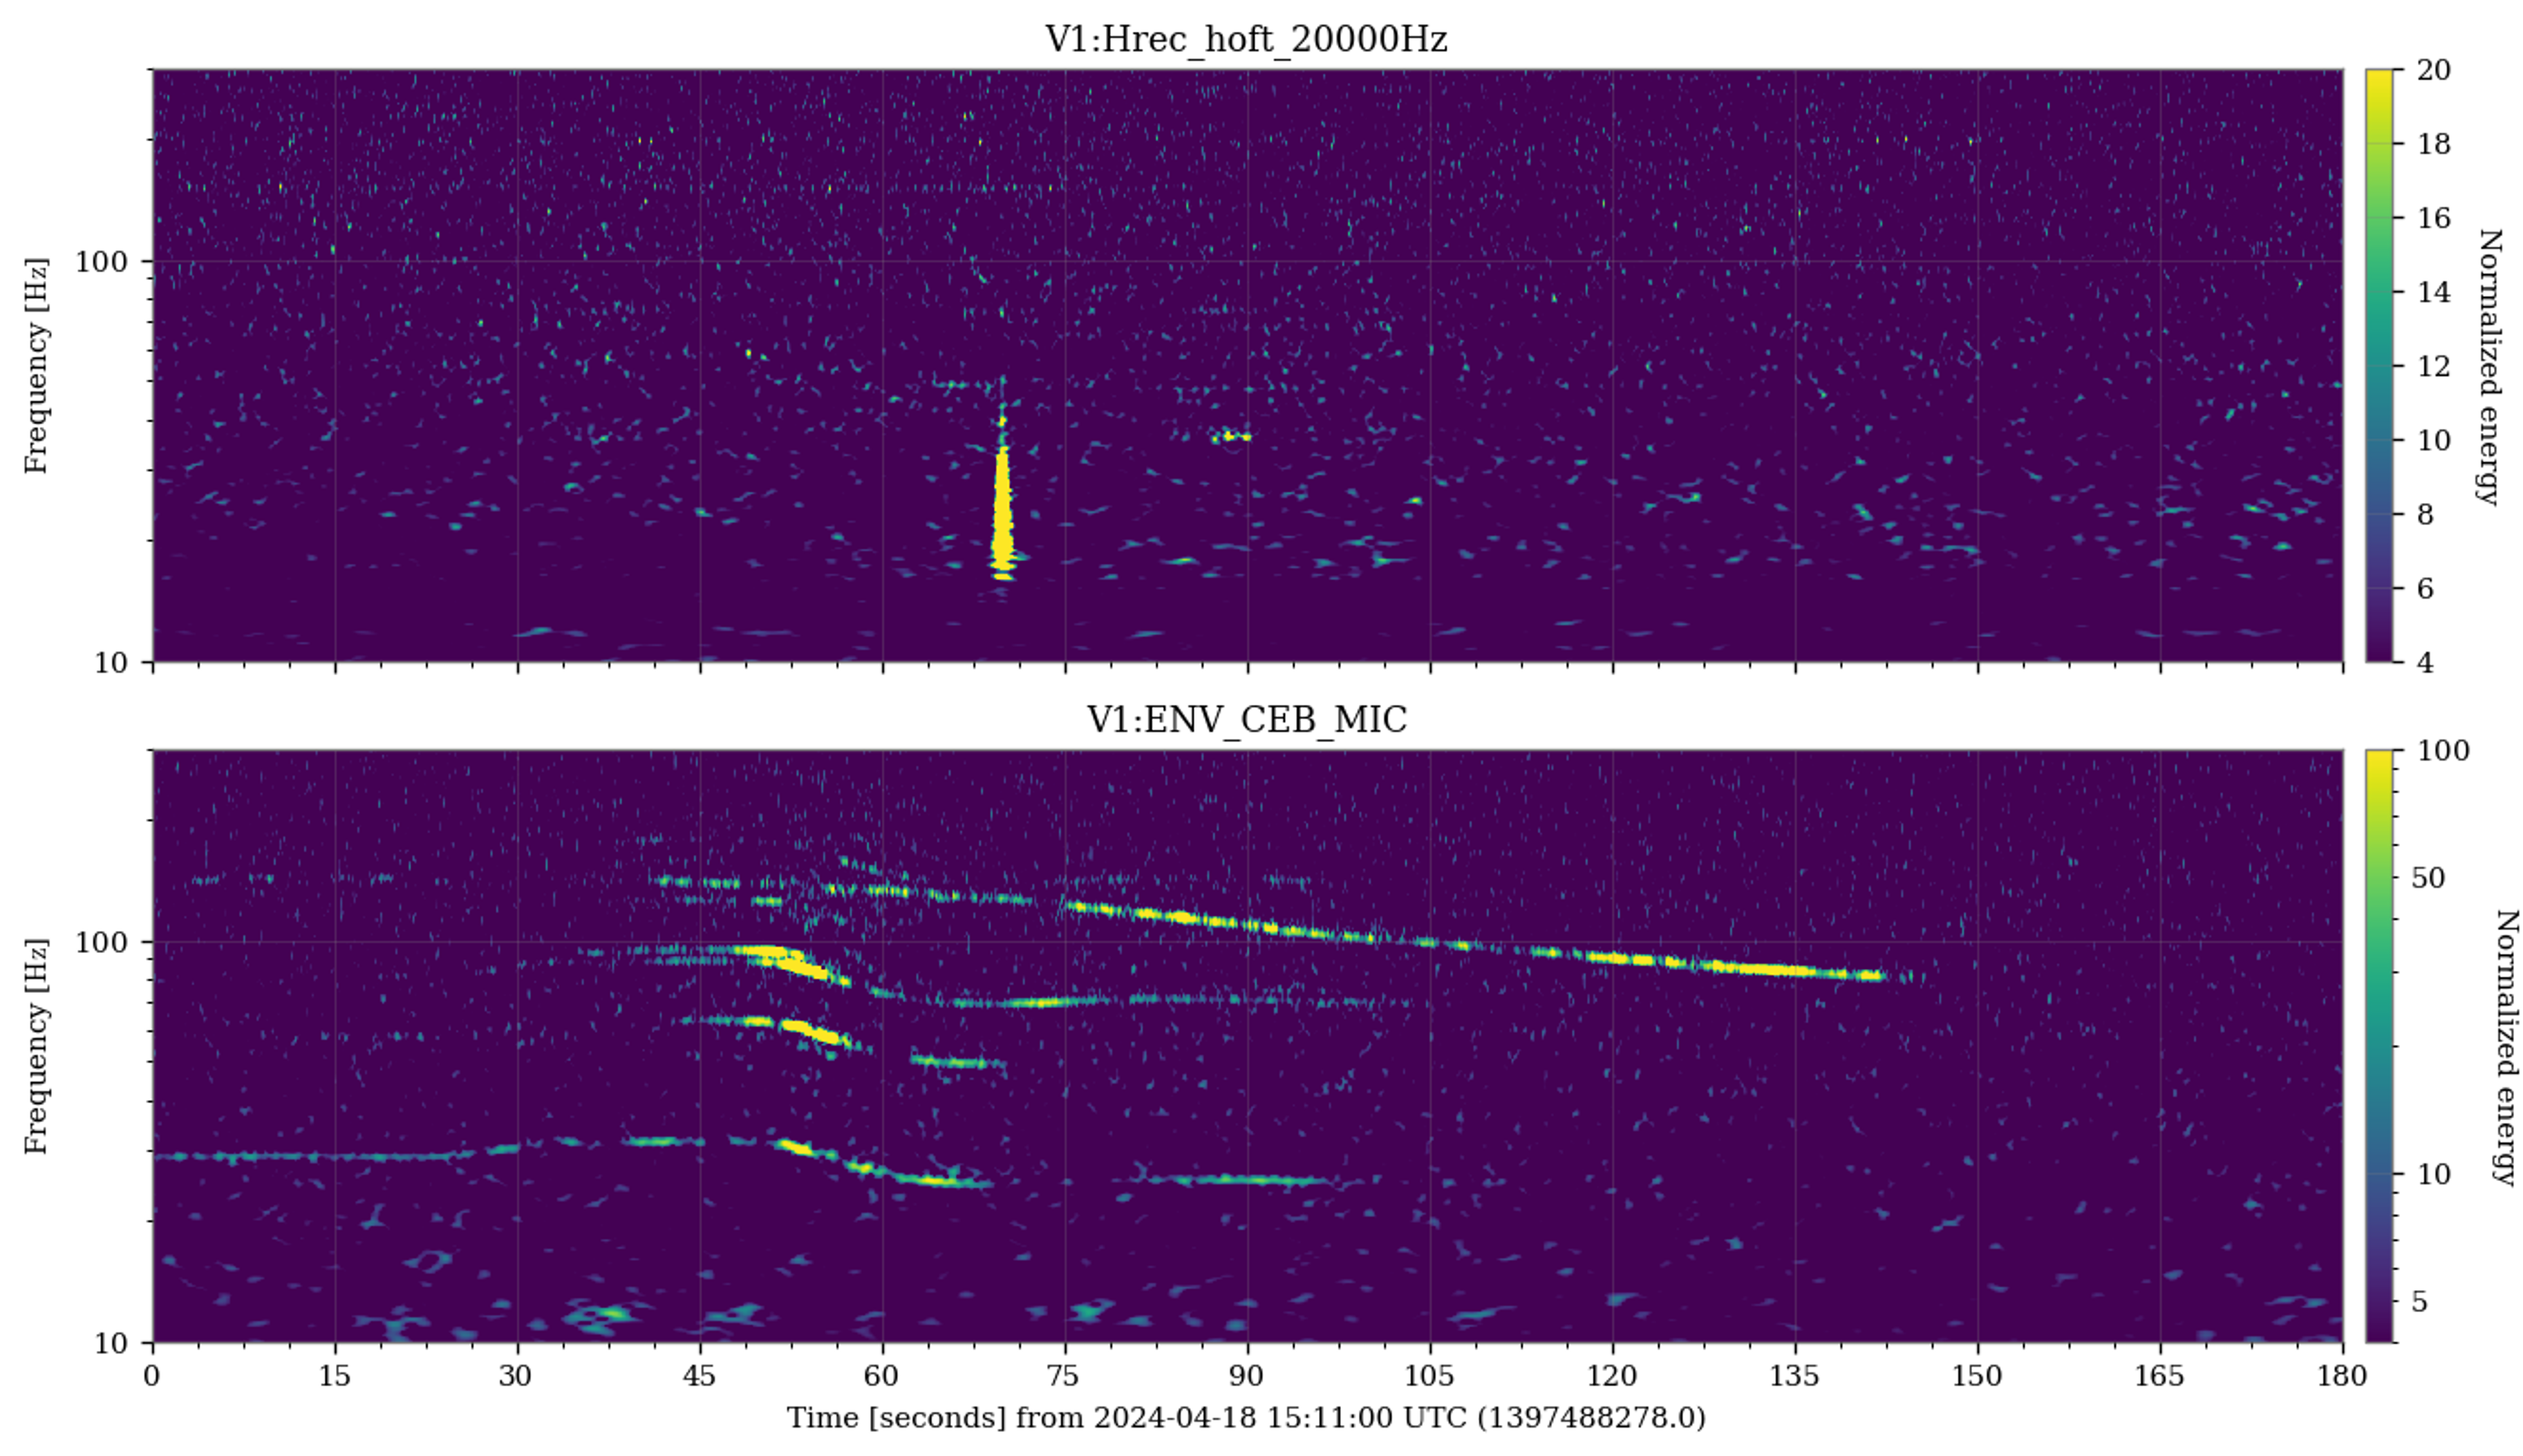
Figure 3: some excess noise but no evident correlation at the time of the transit at 15:11 UTC. Nothing evident during all the other passages of the helicopter.


Prompted by Michal, I verified if the occurrence of Scattered Light glitches from External Injection Bench motion associated with bad weather conditions has changed after the recent intervention and improvement of the EIB ground noise correction: #63763.
I examined the conditions during the last three main events of bad weather and Scattered Light glitches: February 25-26, March 26-27, and April 1-2.
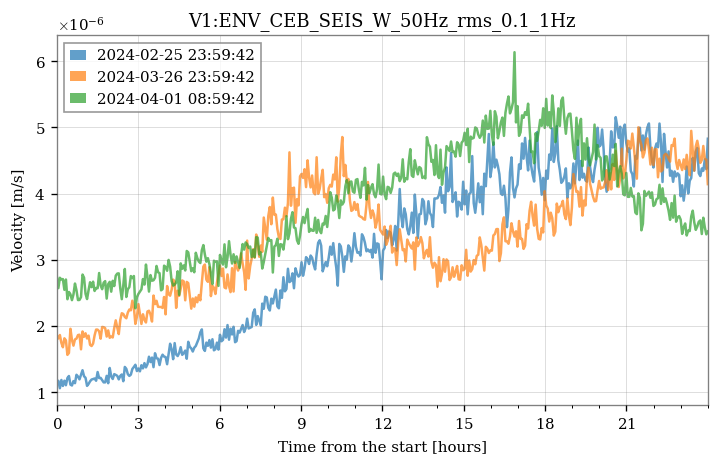
Figure 1: time series of the V1:ENV_CEB_SEIS_W_50Hz_rms_0.1_1Hz during the three examined periods. In all three cases, the level of ground motion in the CEB is comparable.
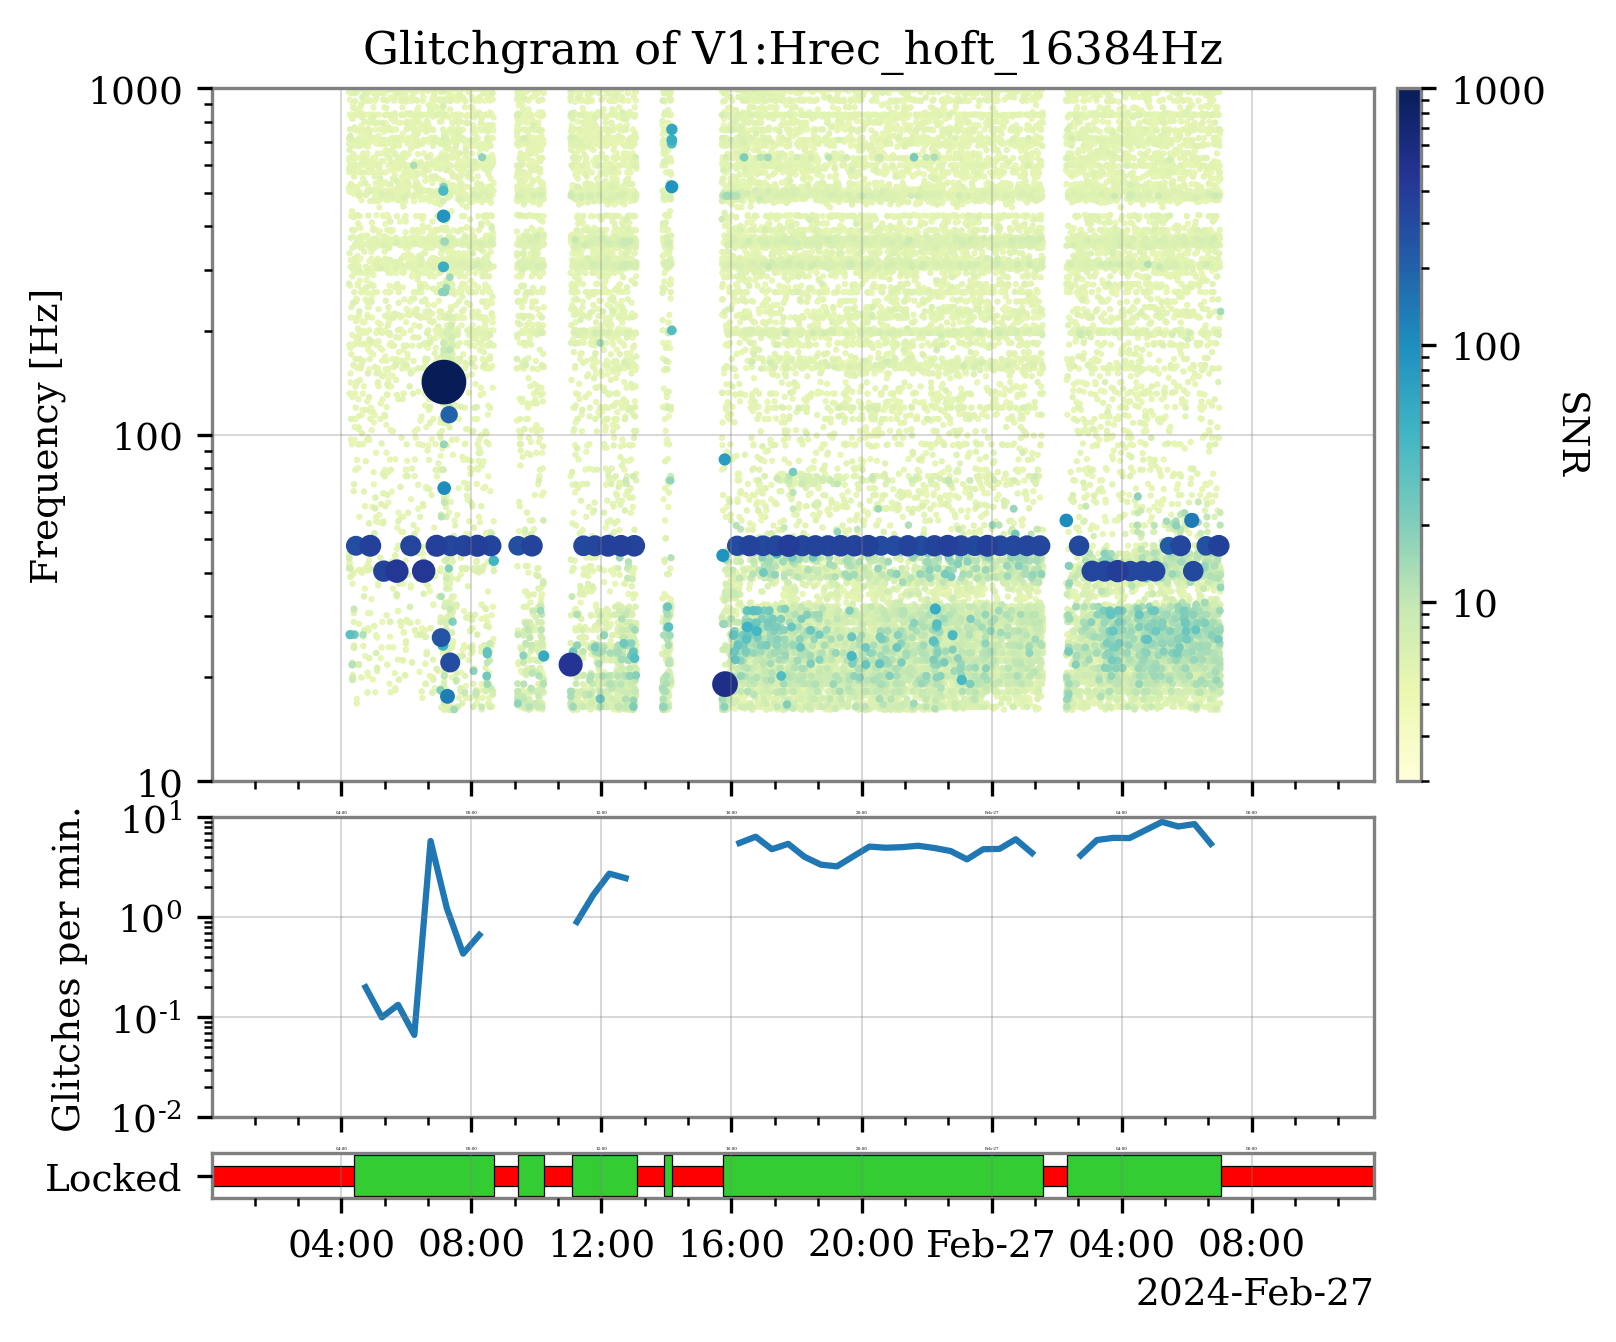
Figures 2, 3 and 4: glitchgrams for Hrec during the three examined periods. The bottom time series represent the glitch rates for those triggers with frequency at peak between 20 and 2048 Hz, and SNR > 6.5. One interesting thing to notice is the presence of additional, very loud glitches with frequency at peak of about 90-100 Hz, associated with the last period of bad weather. Investigations are ongoing to understand their origin and if they are related or not to the ground motion.
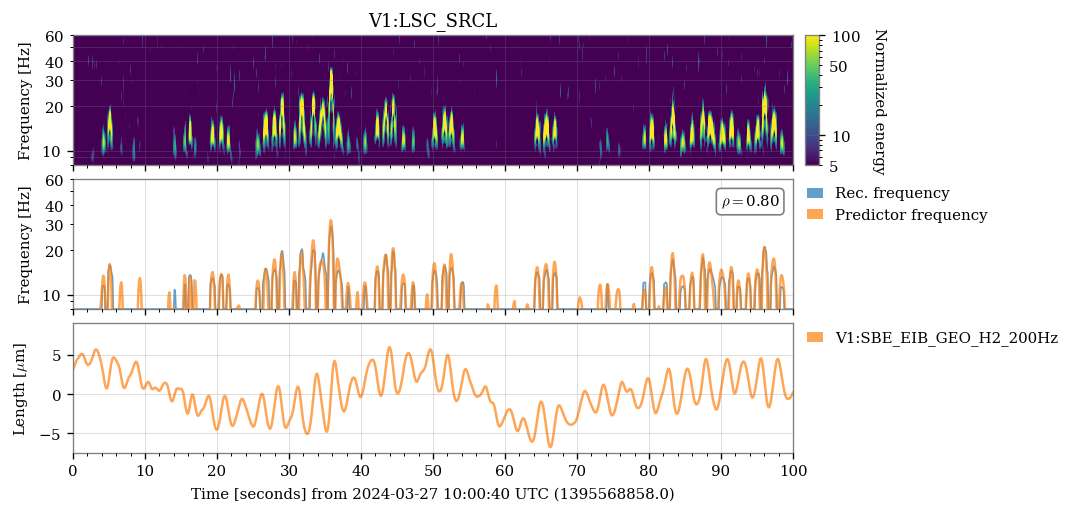
Figures 5, 6 and 7: same as above but for the V1:LSC_SRCL channel, which in previous entries (#63761 and , #63420) was observed with Scattered Light glitches most correlated with the motion of the EIB, represented by the channel V1:SBE_EIB_GEO_H2_200Hz. In the period April 1-2, almost no glitches are present above 20 Hz, while in the other two periods, the rate is very high and correlated with the ground motion. The fact that a similar reduction in the rate of glitches is not visible in Hrec suggests a different origin for them.
Figure 8: a few Scattered Light glitches present in LSC_SRCL and their prediction with the SBE_EIB_GEO_H2_200Hz channel, as described in #63761.
Figure 9: the Scattered Light visible in Hrec is mostly explainable by the motion of the West End mirror. Using the technique described in #63761, the most correlated channel found is Sa_WE_F0_X_500Hz. In the attached text file, the list of all channels with correlation larger than 20%. The reconstruction is not perfect due to the sparseness and irregular shape of the glitches.


This is very interesting. My interpretation of to these results is:
- The work on improving the EIB control has been effective. The scattered light glitches that its motion produces during bad weather is at frequencies below 20Hz, and maybe even 15Hz, which will be more difficult to improve on.
- The main source of scattered light glitches 30Hz-50Hz during bad weather comes from the west end building. The WE suspension local control signal Sa_WE_F0_X_500Hz, may mean the suspension is moving, or that the ground around the suspension is moving. A more detailed analysis of all the position sensors in the WE building is needed to determine what is the source of scattered light in the WE building, but it is unlikely to be the mirror itself.
I have refined the analysis in the main entry to include more glitches and all the auxiliary channels measuring positions, velocities and accelerations, as described in this git issue. The results are contained in the attached text files. These confirm and expand what is already presented in the main entry, that is, a strong correlation of these glitches with the movement of the West End bench and suspension. Correlations with velocity and acceleration sensors are instead much smaller. They tend to point to the motion of parts of the North End building, but plotting the predictor frequencies superimposed to the spectrogram of Hrec shows in fact no convincing correlations. Example in figure 1.
Continuing the investigation of the spectral noise on the first week of O4b data, we found an interesting structure of "wandering sidebands" around the 50 Hz line. (S
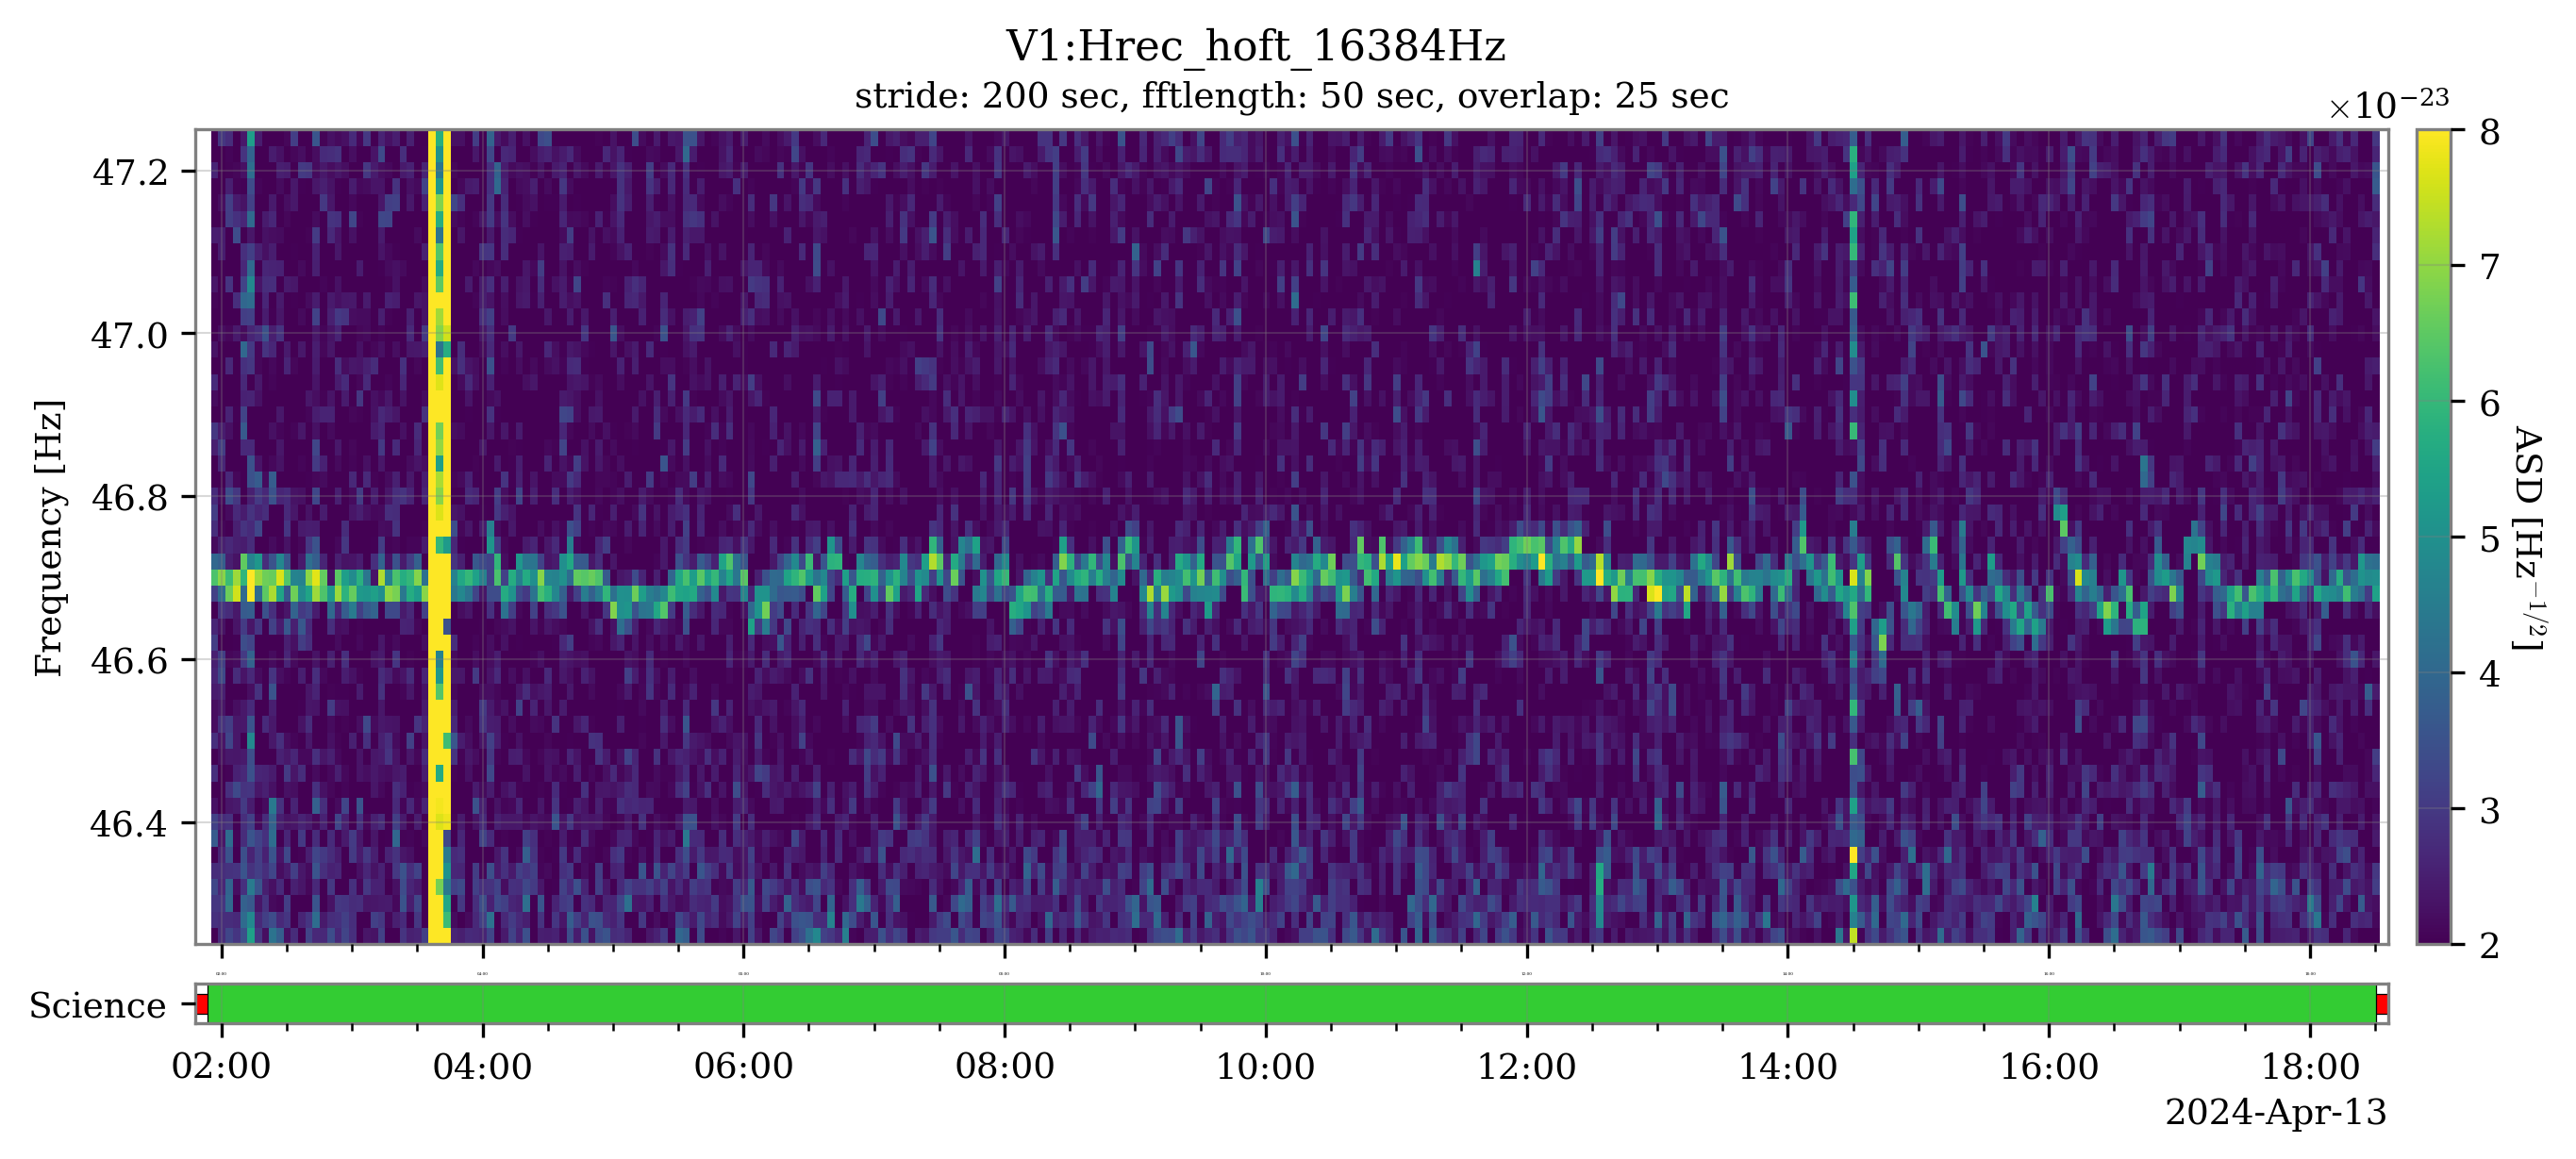
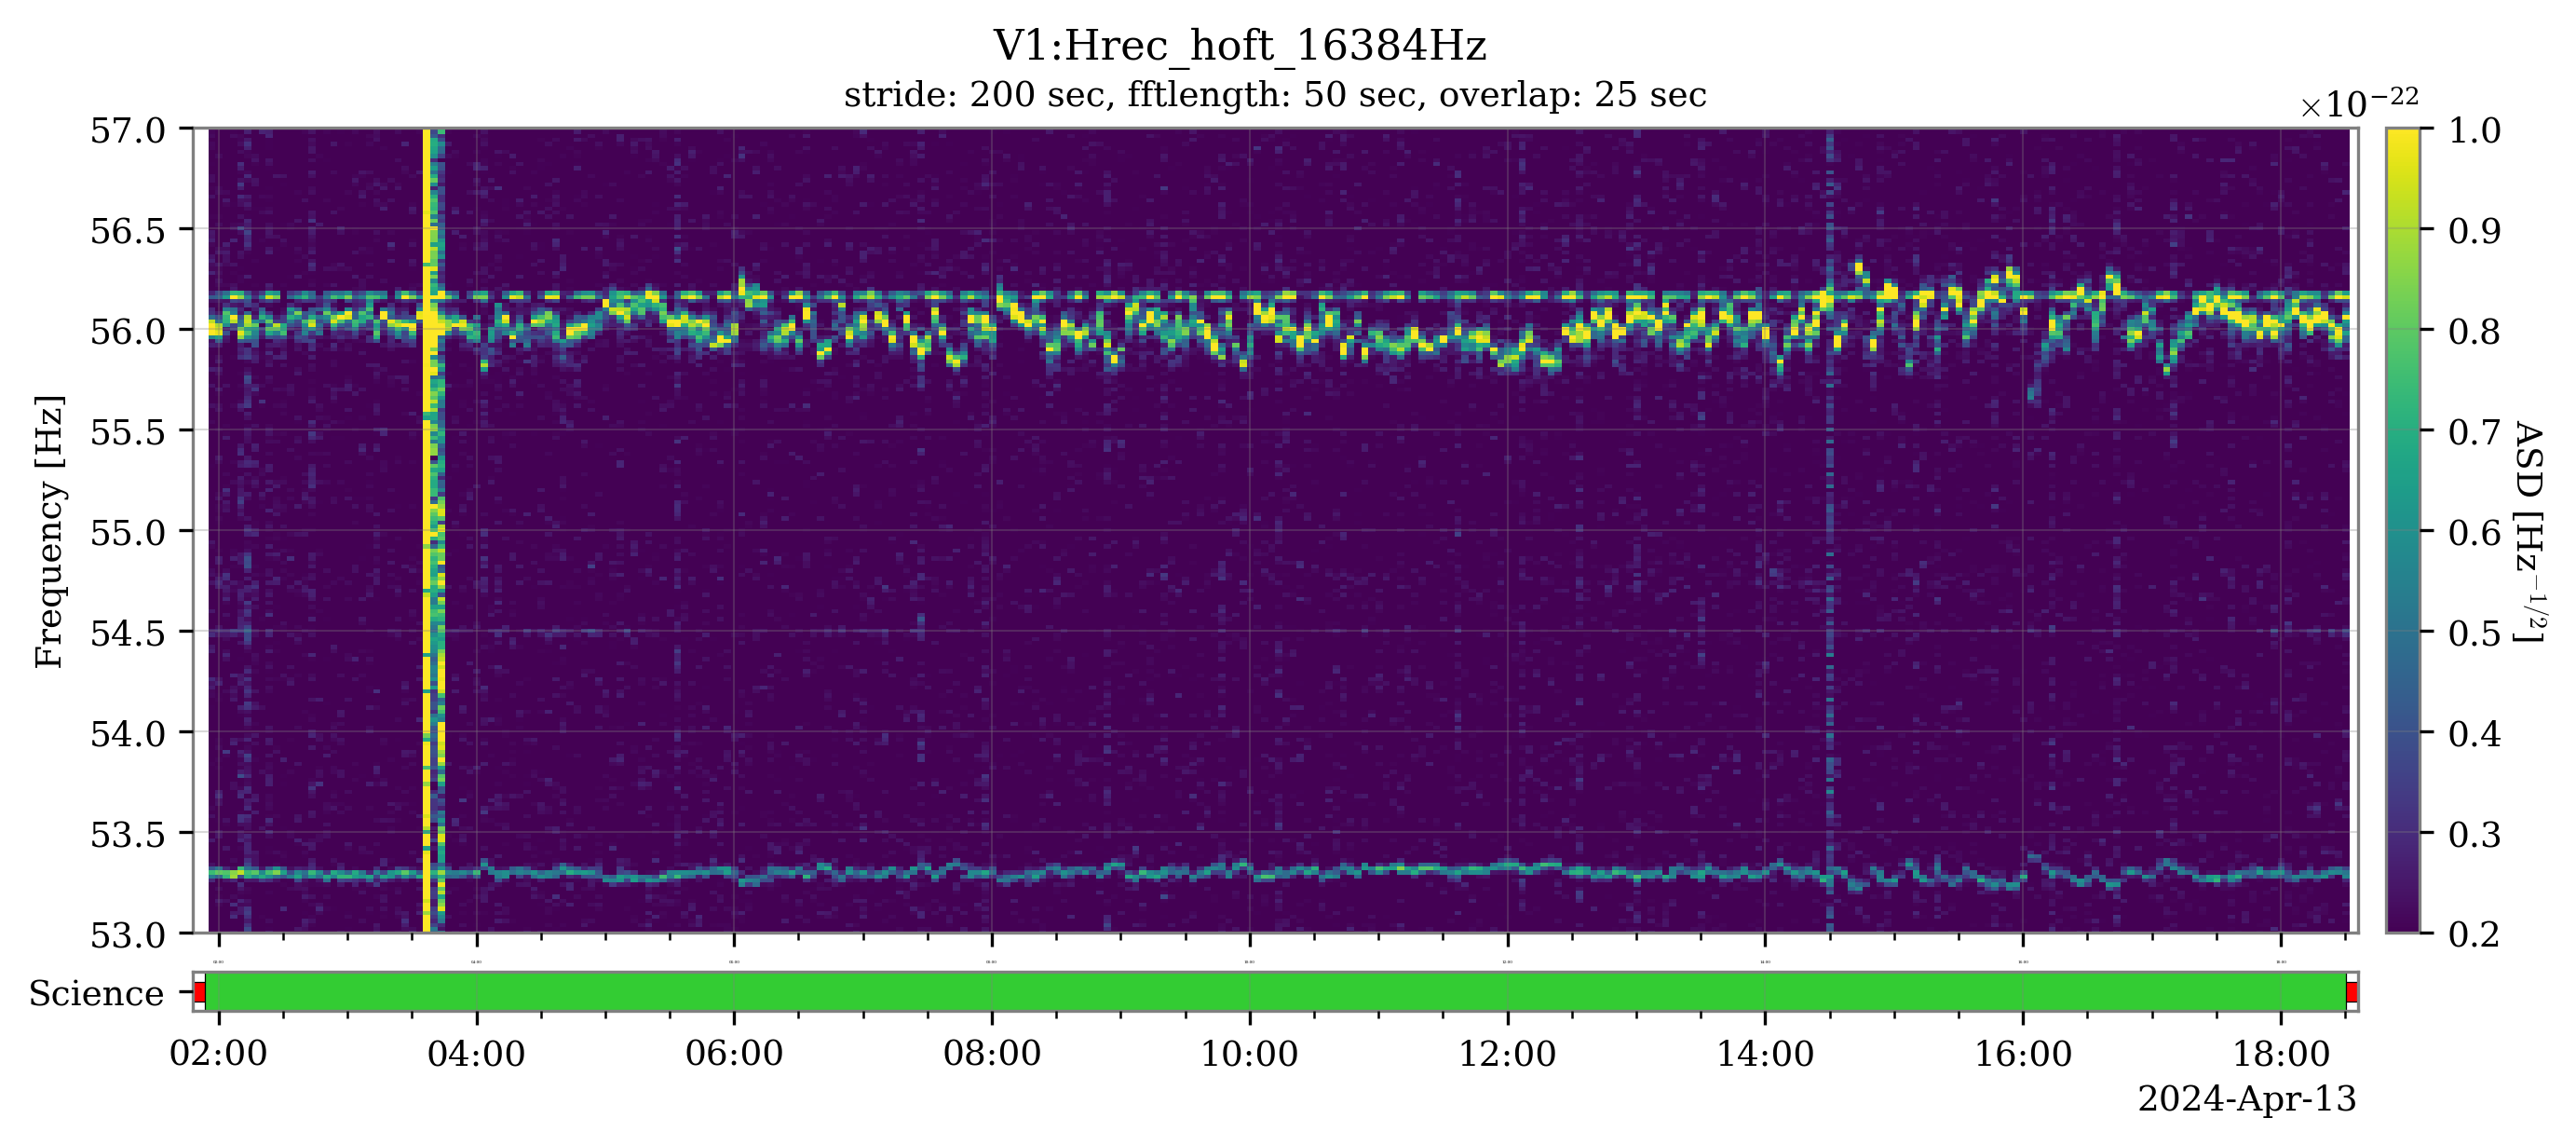
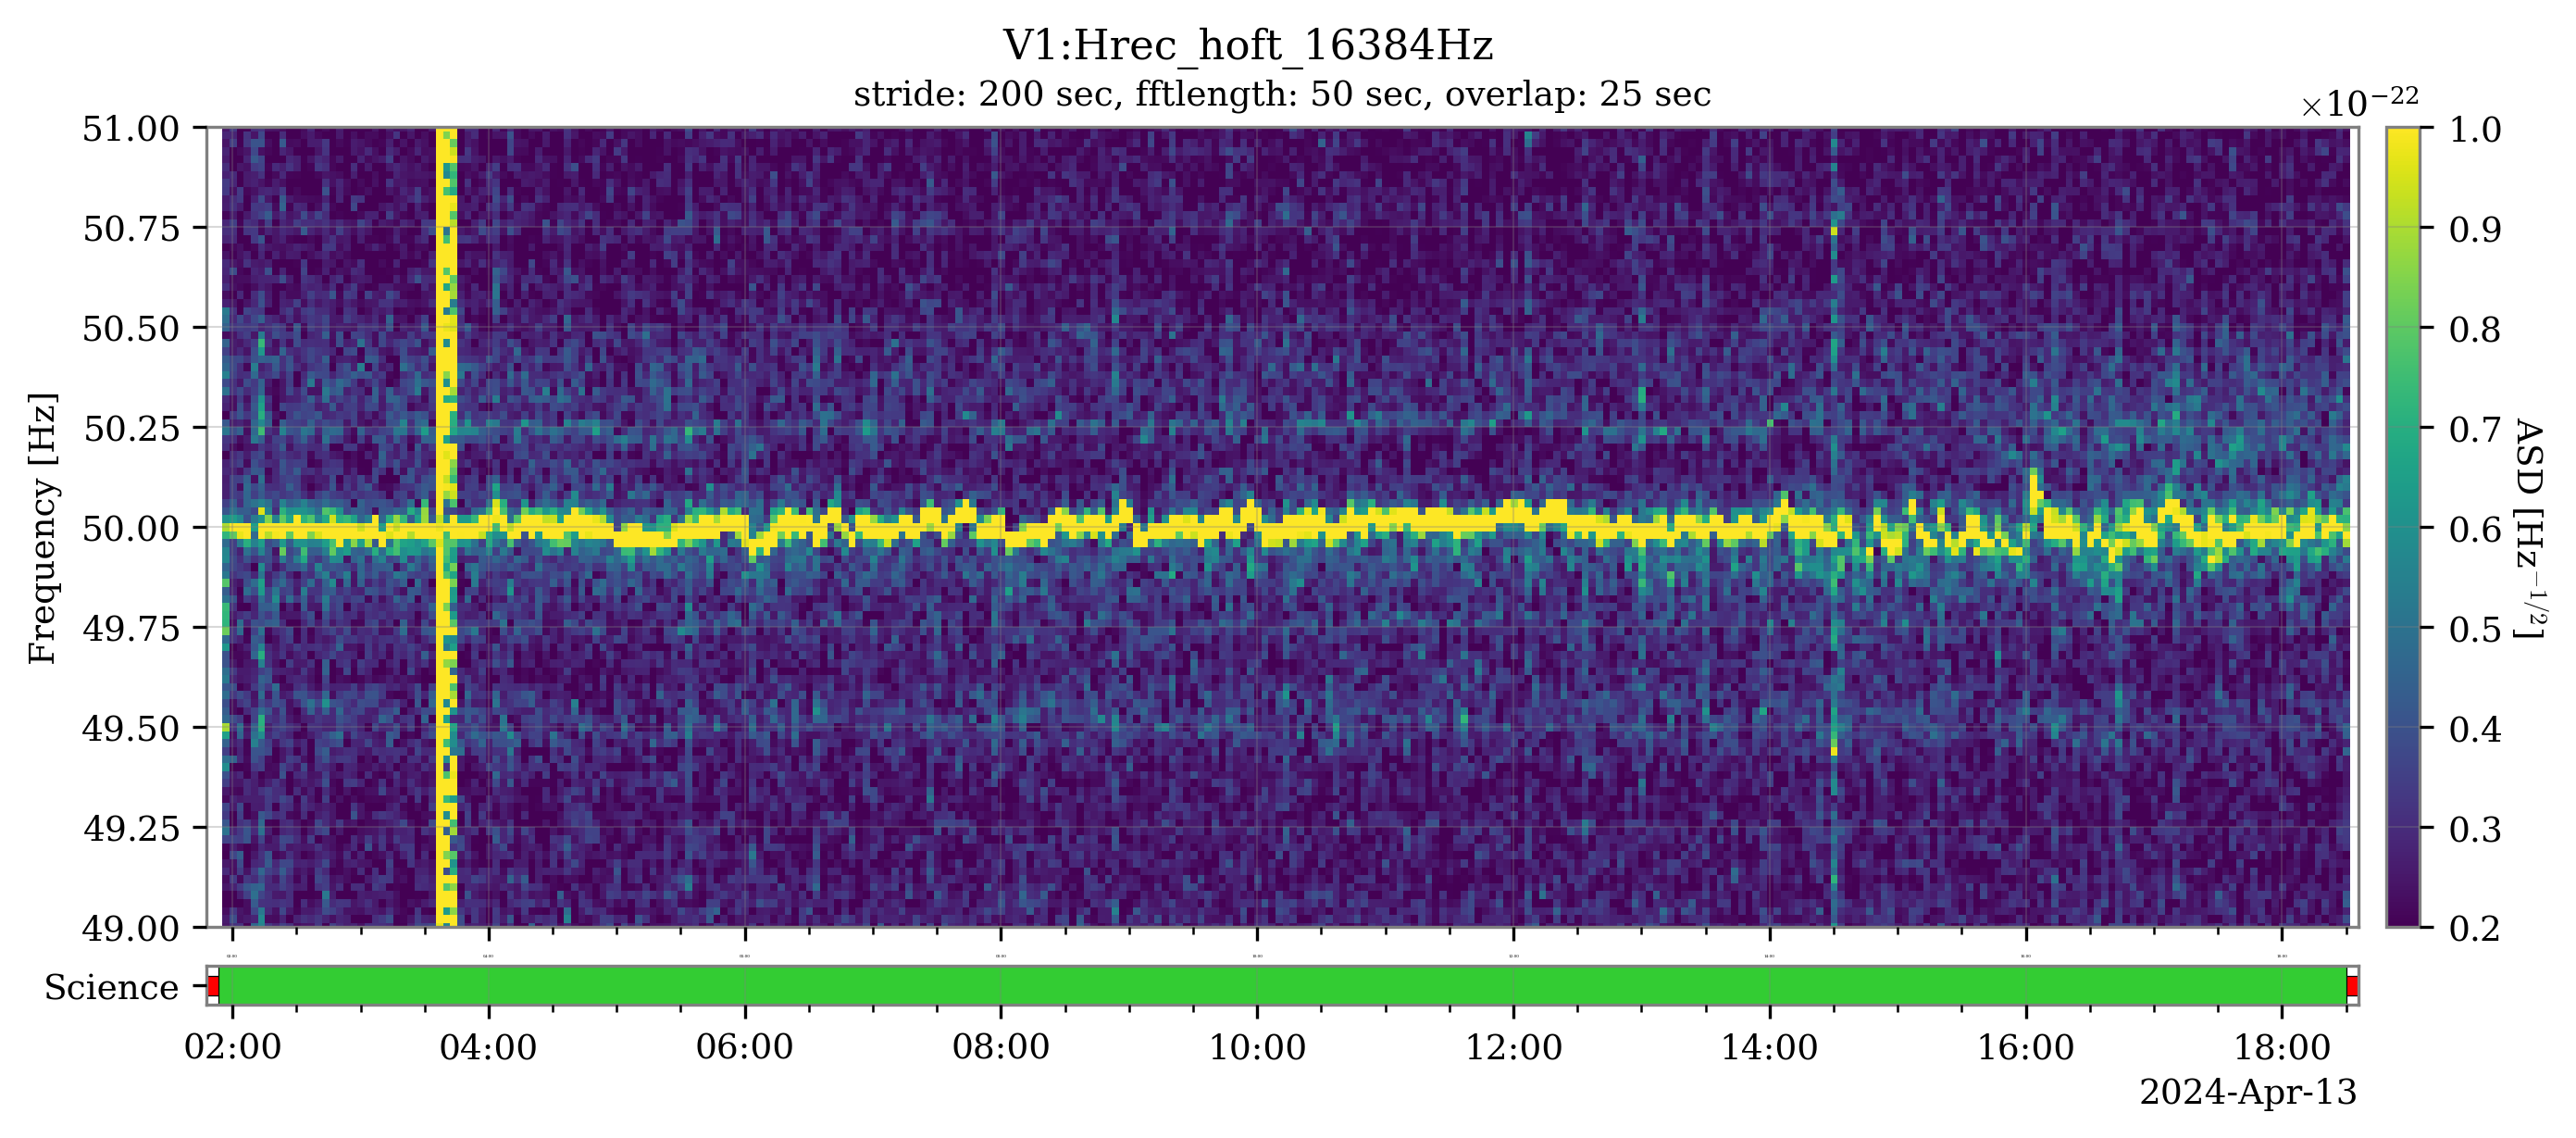
Figure 1 shows the spectrogram in the region 42-58 Hz around the frequency of the electric mains. Two pairs of wandering sidebands are visible at 44 (Figure 2) and 56 Hz, and at 46.7 (Figure 3) and 53.3 Hz (Figure 5).
The oscillations in frequency, especially those of the 44 and 56 Hz lines, are the same as those of the 50 Hz line (Figure 4) but enlarged by many (~20) times: ~0.50 Hz vs ~0.025 Hz
Additionally, taking advantage of a couple of glitches present in the analyzed data period (the vertical lines), we notice that the 44 and 47.3 Hz lines are synchronous with the 50 Hz line. Also, the 53.3 Hz line seems to have the same phase, while the one at 56 Hz is flipped vertically: Figure 5.
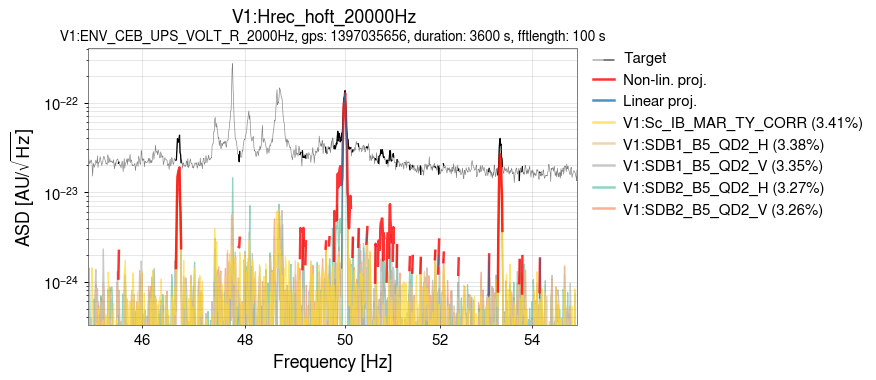
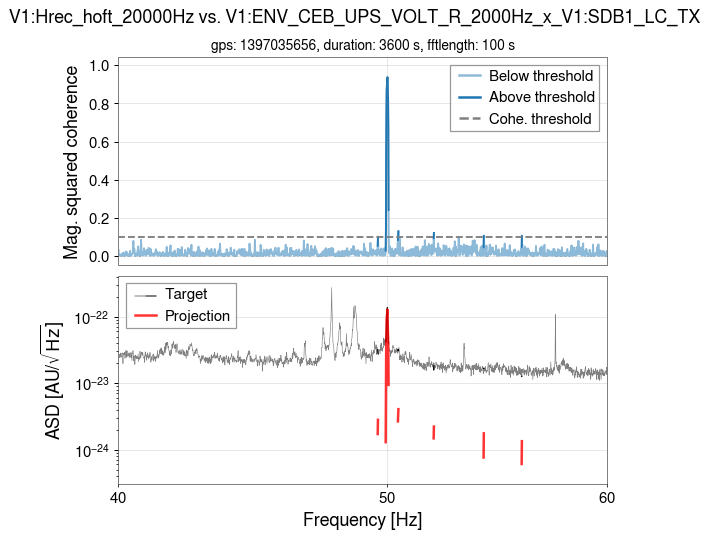
The search for bilinear couplings with MONET highlighted that the 46.7 and 53.3 Hz sidebands are produced by the modulation of the mains line (ENV_CEB_UPS_VOLT_R_2000Hz) and the ASC_DIFFp_T{X,Y} angular control channels: Figure 6 and text file.
A barely negligible coherence has been found for the lines at 44 and 56 Hz; just a 0.1 with SDB1_LC_TX at 56 Hz: Figure 7. This could be a consequence of the large variations in the frequency of the line, which dilute the cohere over multiple frequency bins and, averaged gets small.
Of course, the same structure is present around the other harmonics of the 50 Hz line.


As Piernicola confirmed, the sidebands at 46.7 Hz and 53.3 Hz are the beating between 50 Hz and DIFFp_TX line at 3.3 Hz (purple curve).
Indeed, when the DIFFp_TX line was set to 4.8 Hz, there were two sidebands at 45.2 Hz and 54.8 Hz, respectively (blue curve).

ERRATA CORRIGE: the sidebands at 44 and 56 Hz are non-physical. These are just an aliasing artefact, consequence of an improper chunk-by-chunk downsampling to produce the resulting spectrogram.
Figure 1: fixed version of the spectrogram in the range 42-58 Hz.
Figure 2: animated GIF that compares the correct spectrogram and the wrong one in the main entry.
The 50 Hz sidebands at 0.75 Hz are modelled by the bilinear coupling of ENV_CEB_UPS_VOLT_R_2000Hz and ASC_DIFFp_TX, as visible in the daily MONET results of May 2. The modulator ASC_COMMp_TX produces interesting structures too, although just below the default coherence threshold set on the daily MONET analysis.
Looking at the spectrogram of Hrec since April 1st, we noticed an increase of a sideband noise around the 50 Hz during May 2nd-4th, Figure1 (top). It seems to be correlated to a decrease of accuracy of DIFFp_TX (bottom).
As in #64018, in Figure 2 we observe two couple of sidebands probably due to a beating between the 50 Hz and DIFFp_TX at ±0.75 Hz and ±0.42 Hz (roughly).
A residual of these sidebands seems often present: purple curve of Figure 2 and spectrogram in Figure 1.


In the framework of the ongoing investigations for the study of spectral noise, I repeated the analysis done for the mini-Engineering Run, with the estimate of a high-resolution sensitivity curve and the rough identification of the main spectral lines, as described in this logbook entry: #63221. The result can be used as a reference and for comparison with the output of more refined tools, such as NoEMi.
As a remark, the frequency resolution of 1mHz is obtained with 1000 second-long FFTs. This duration is constrained by the 25-minute glitches; estimating the ASD with median averages is robust to these glitches if most of the FFTs are not affected by their presence. This requires using FFTs shorter than 25 minutes (1500 sec).
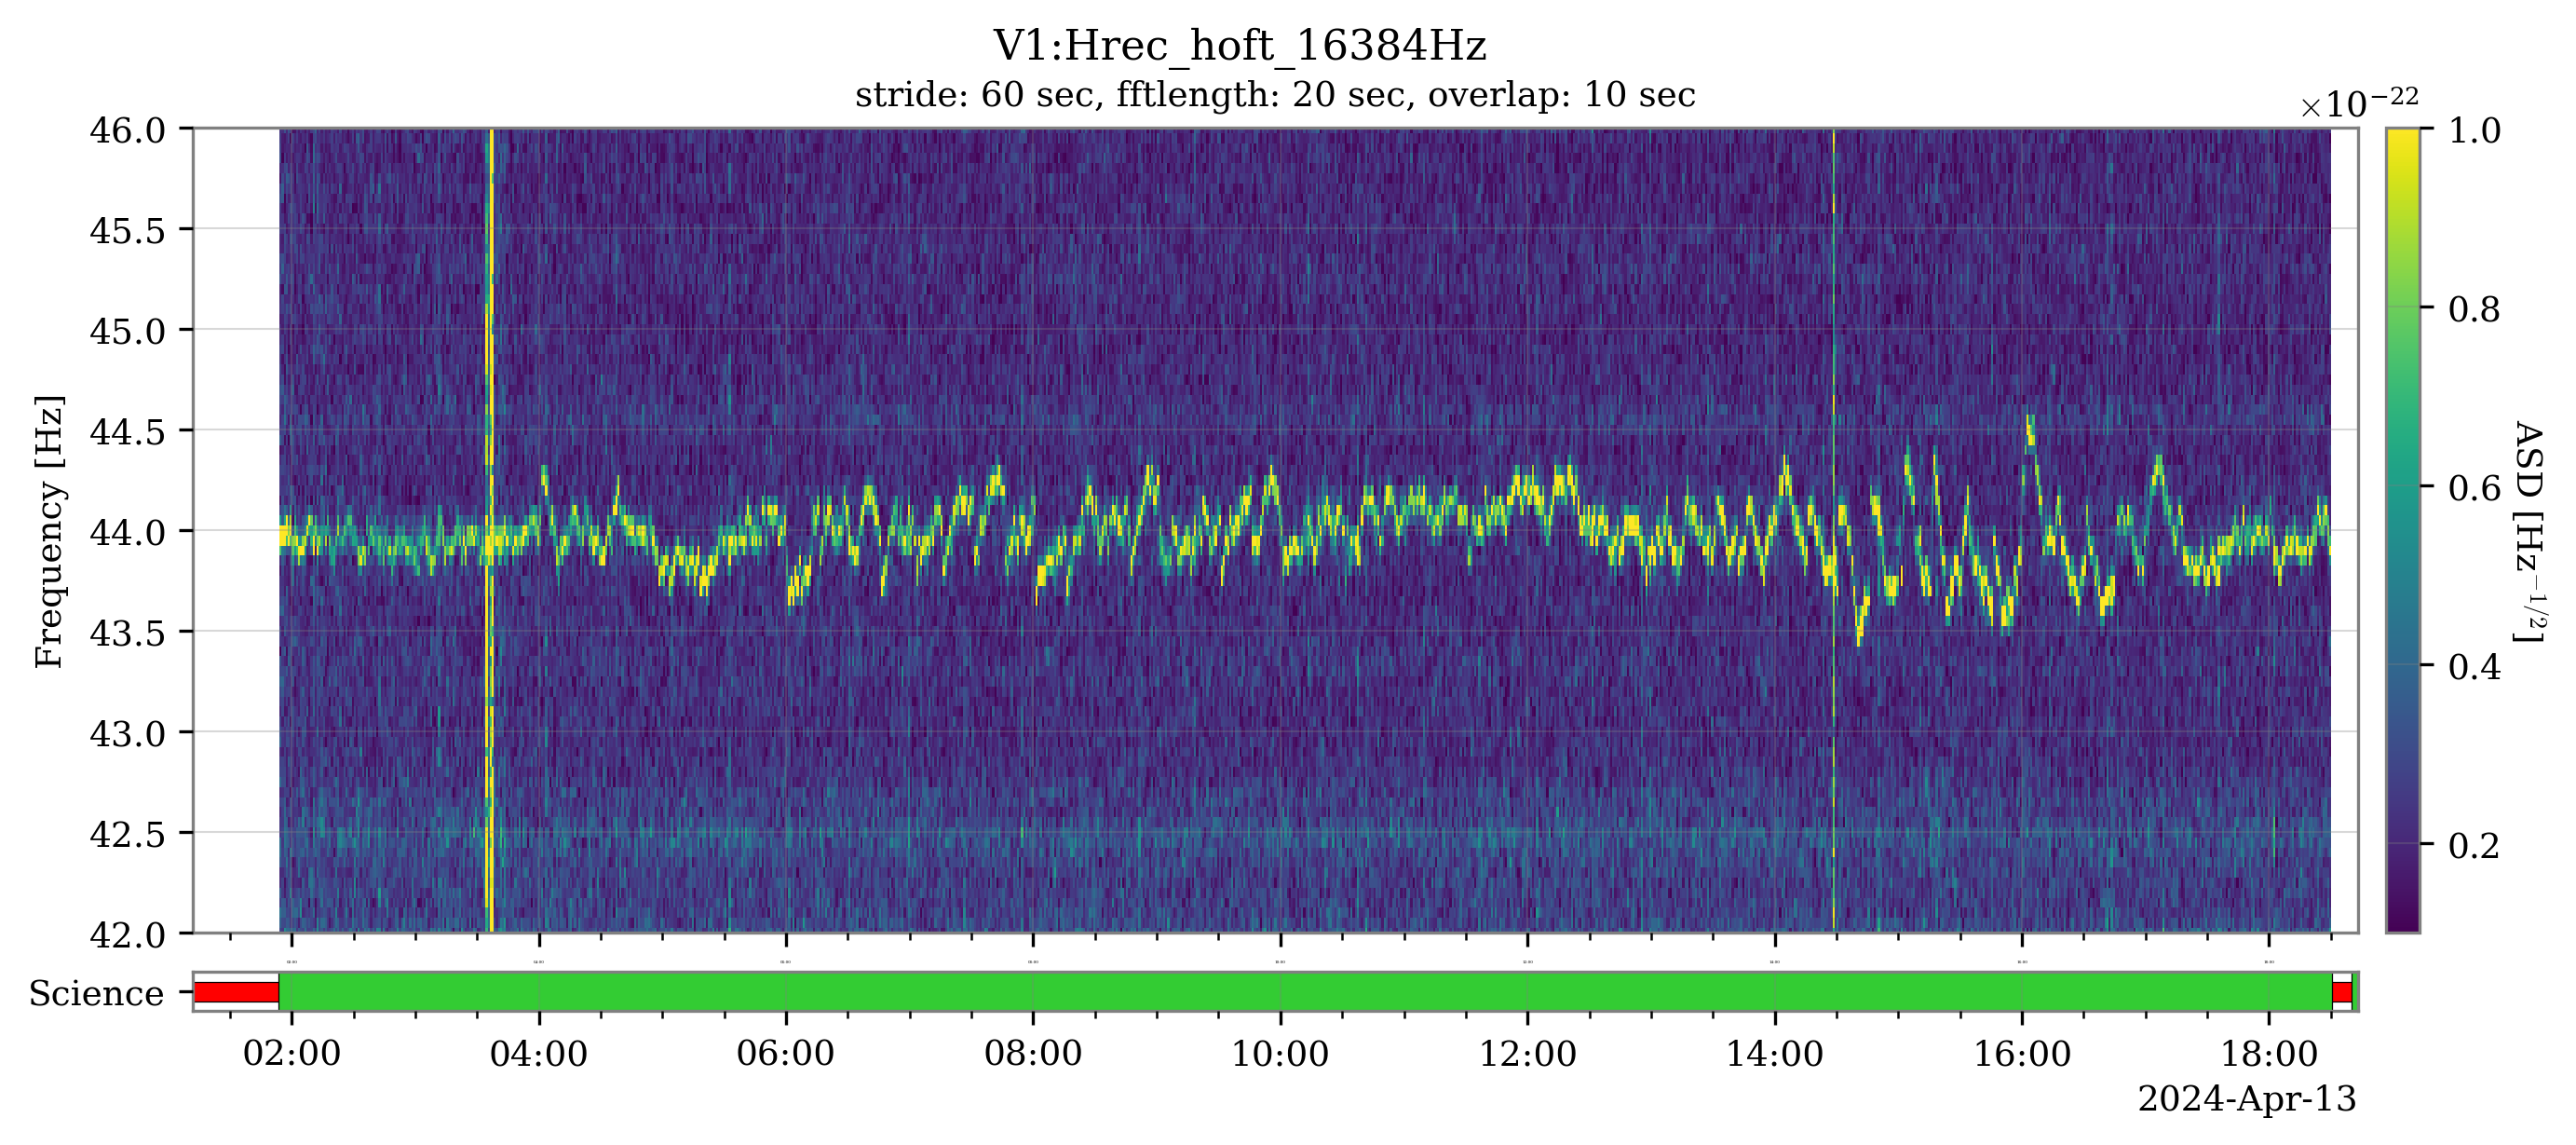
The data segment to be analyzed was the one with the longest duration in Science mode, weighted by the lowest coefficient of variation. The choice fell on the segment: 2024-04-13 01:53:18 to 2024-04-13 18:30:04 (59806.0 sec).
I attach to this entry the pdf with the details of the various frequency regions of the spectrum and the CSV with the identified lines. I plan to repeat this analysis for the next weeks, and attach the results in this git issue and its sub-tasks, for reference.
I'm adding also the following images:
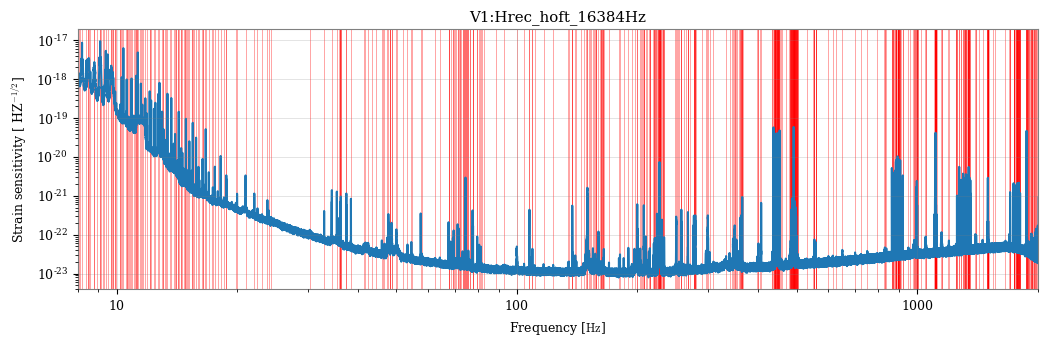
Figure 1: high-resolution sensitivity curve with red lines corresponding to the identified spectral lines. Refer to the PDF file for the details.
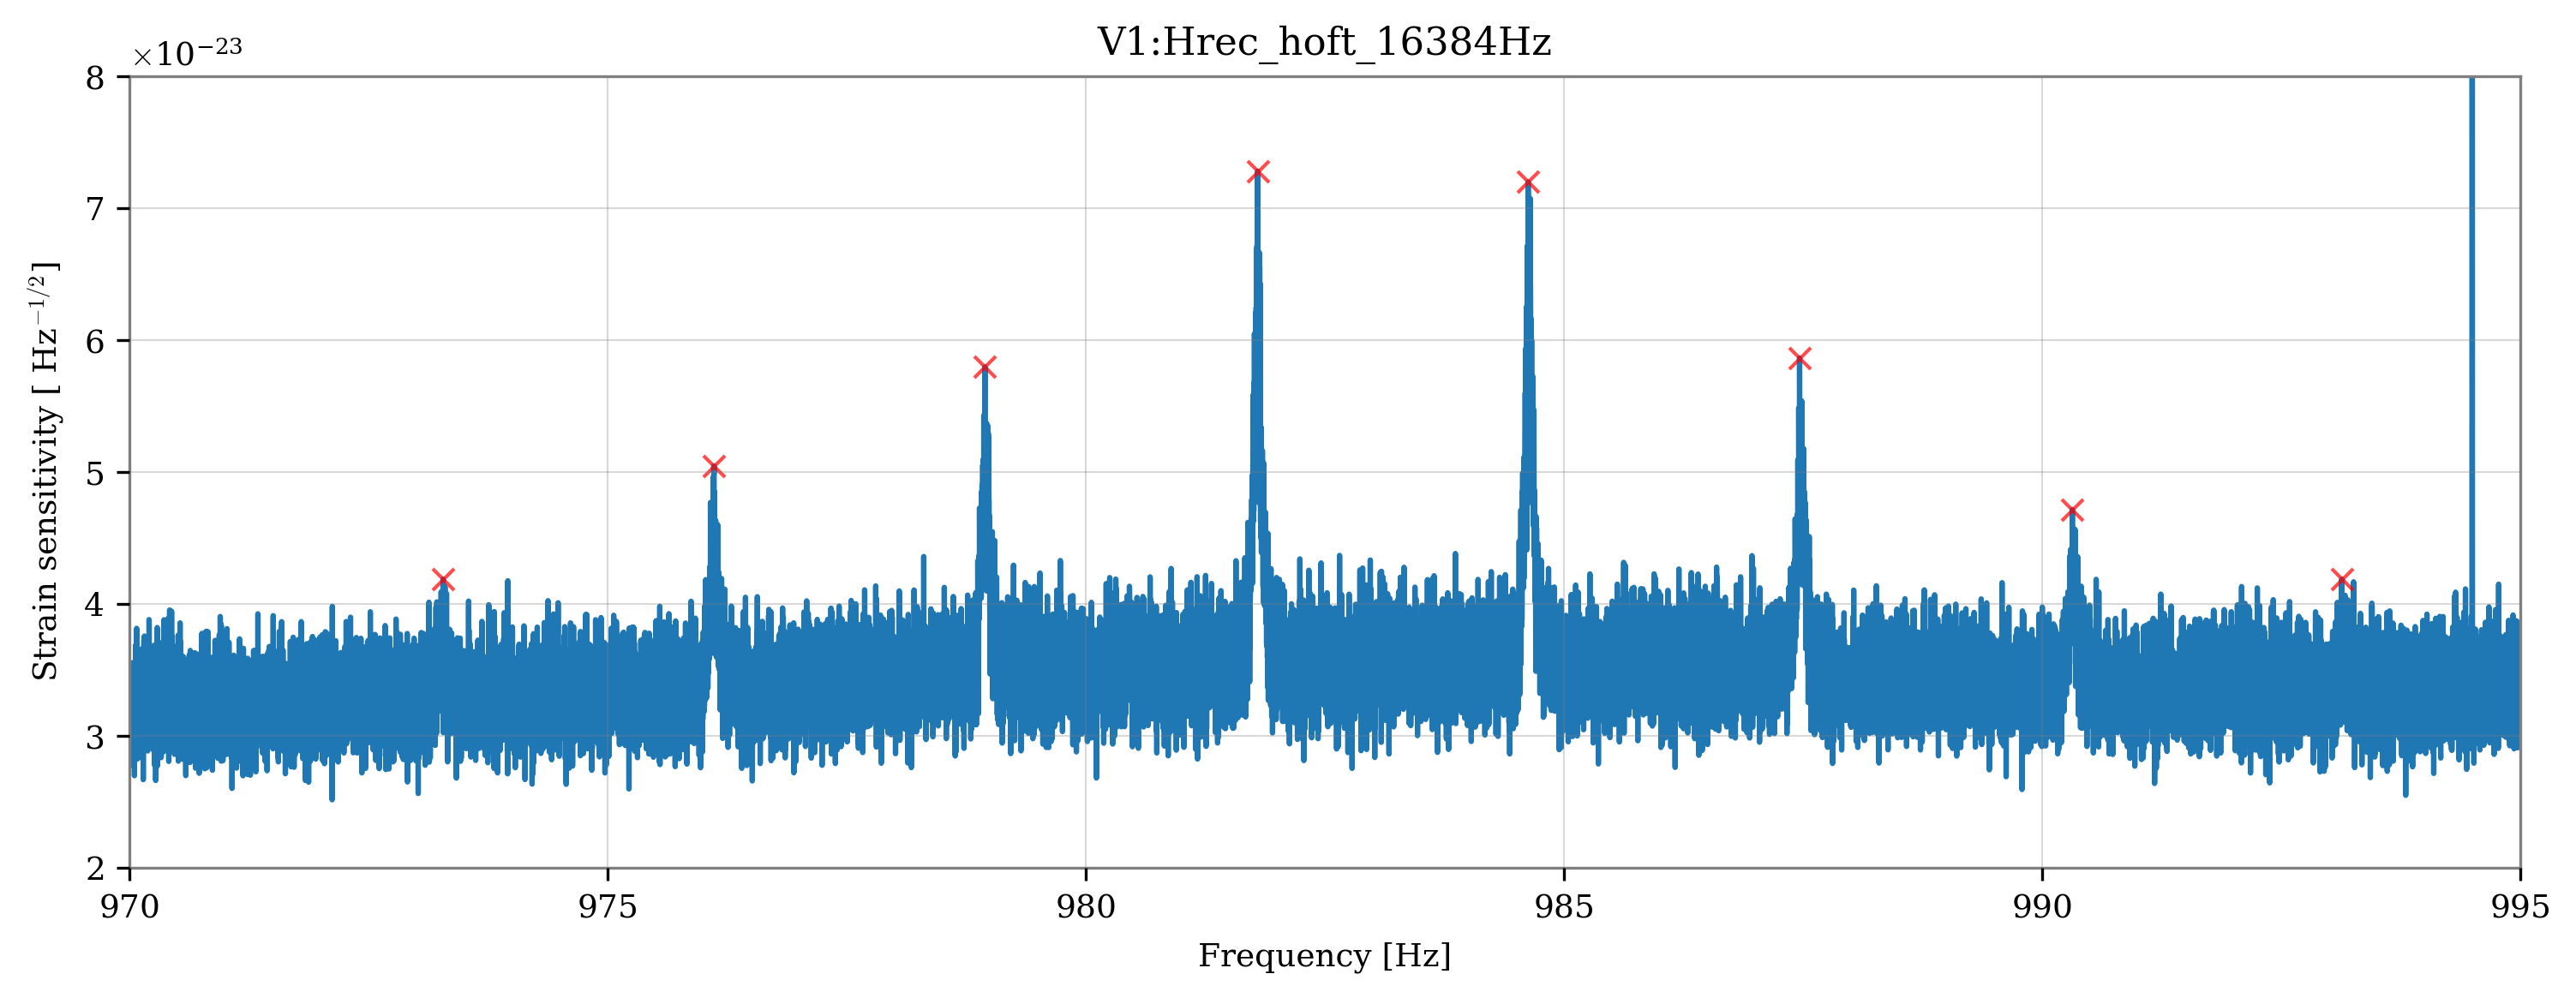
Figure 2: detail of the 970-995 Hz region, showing a comb of lines spaced about ~2.83 Hz (0.35 sec).
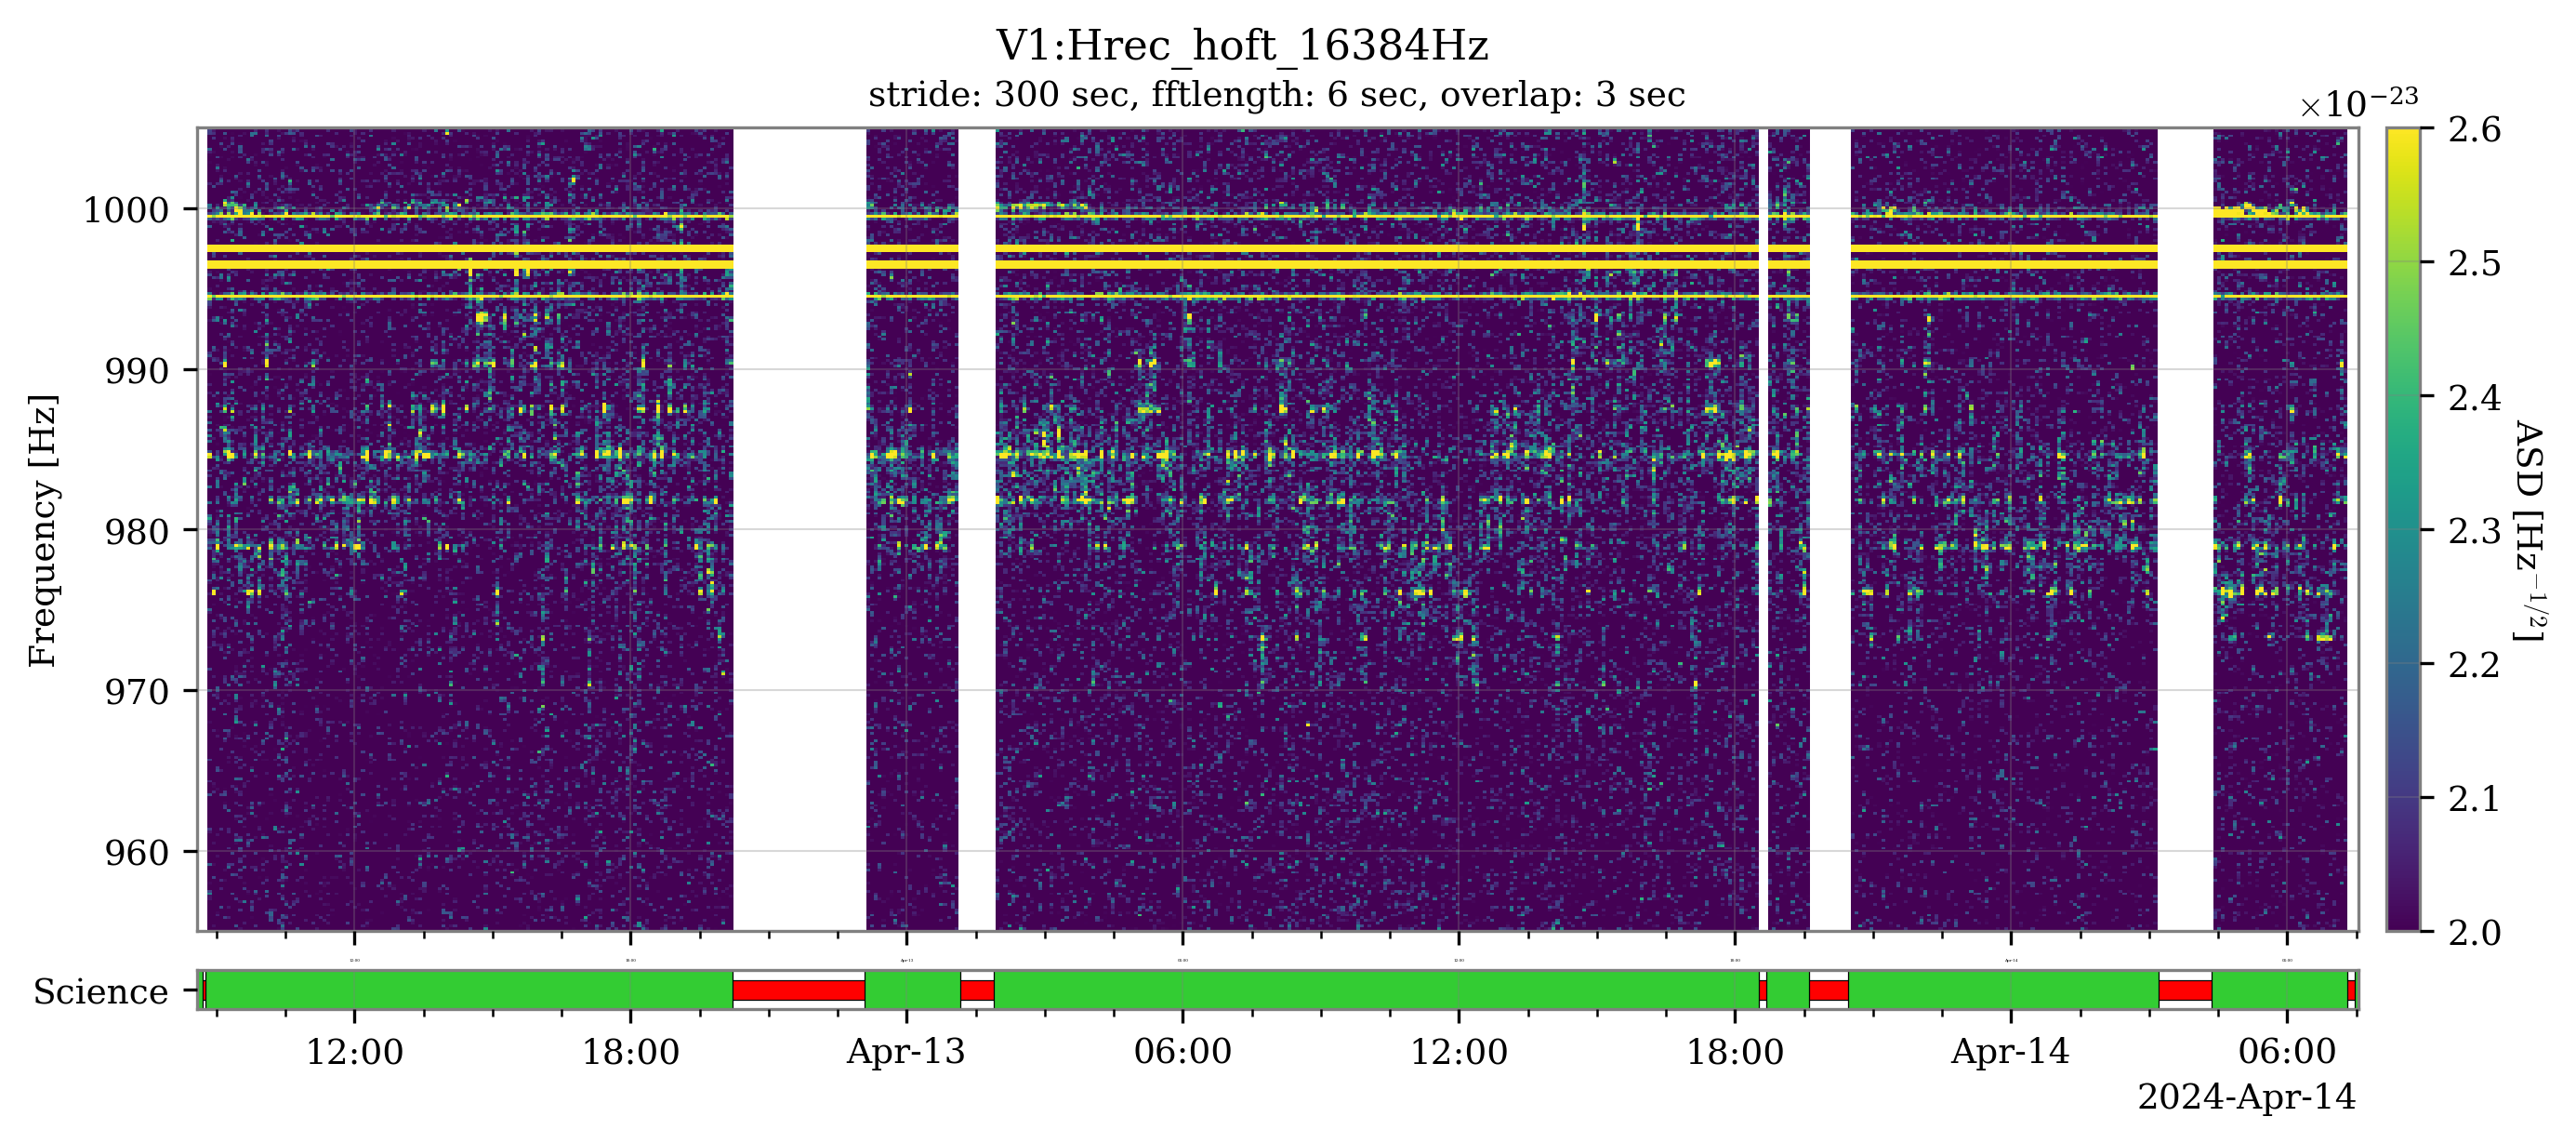
Figure 3: spectrogram of the 955-1005 Hz region, showing the wandering line already documented in these logbook entries: #60093, #61873.


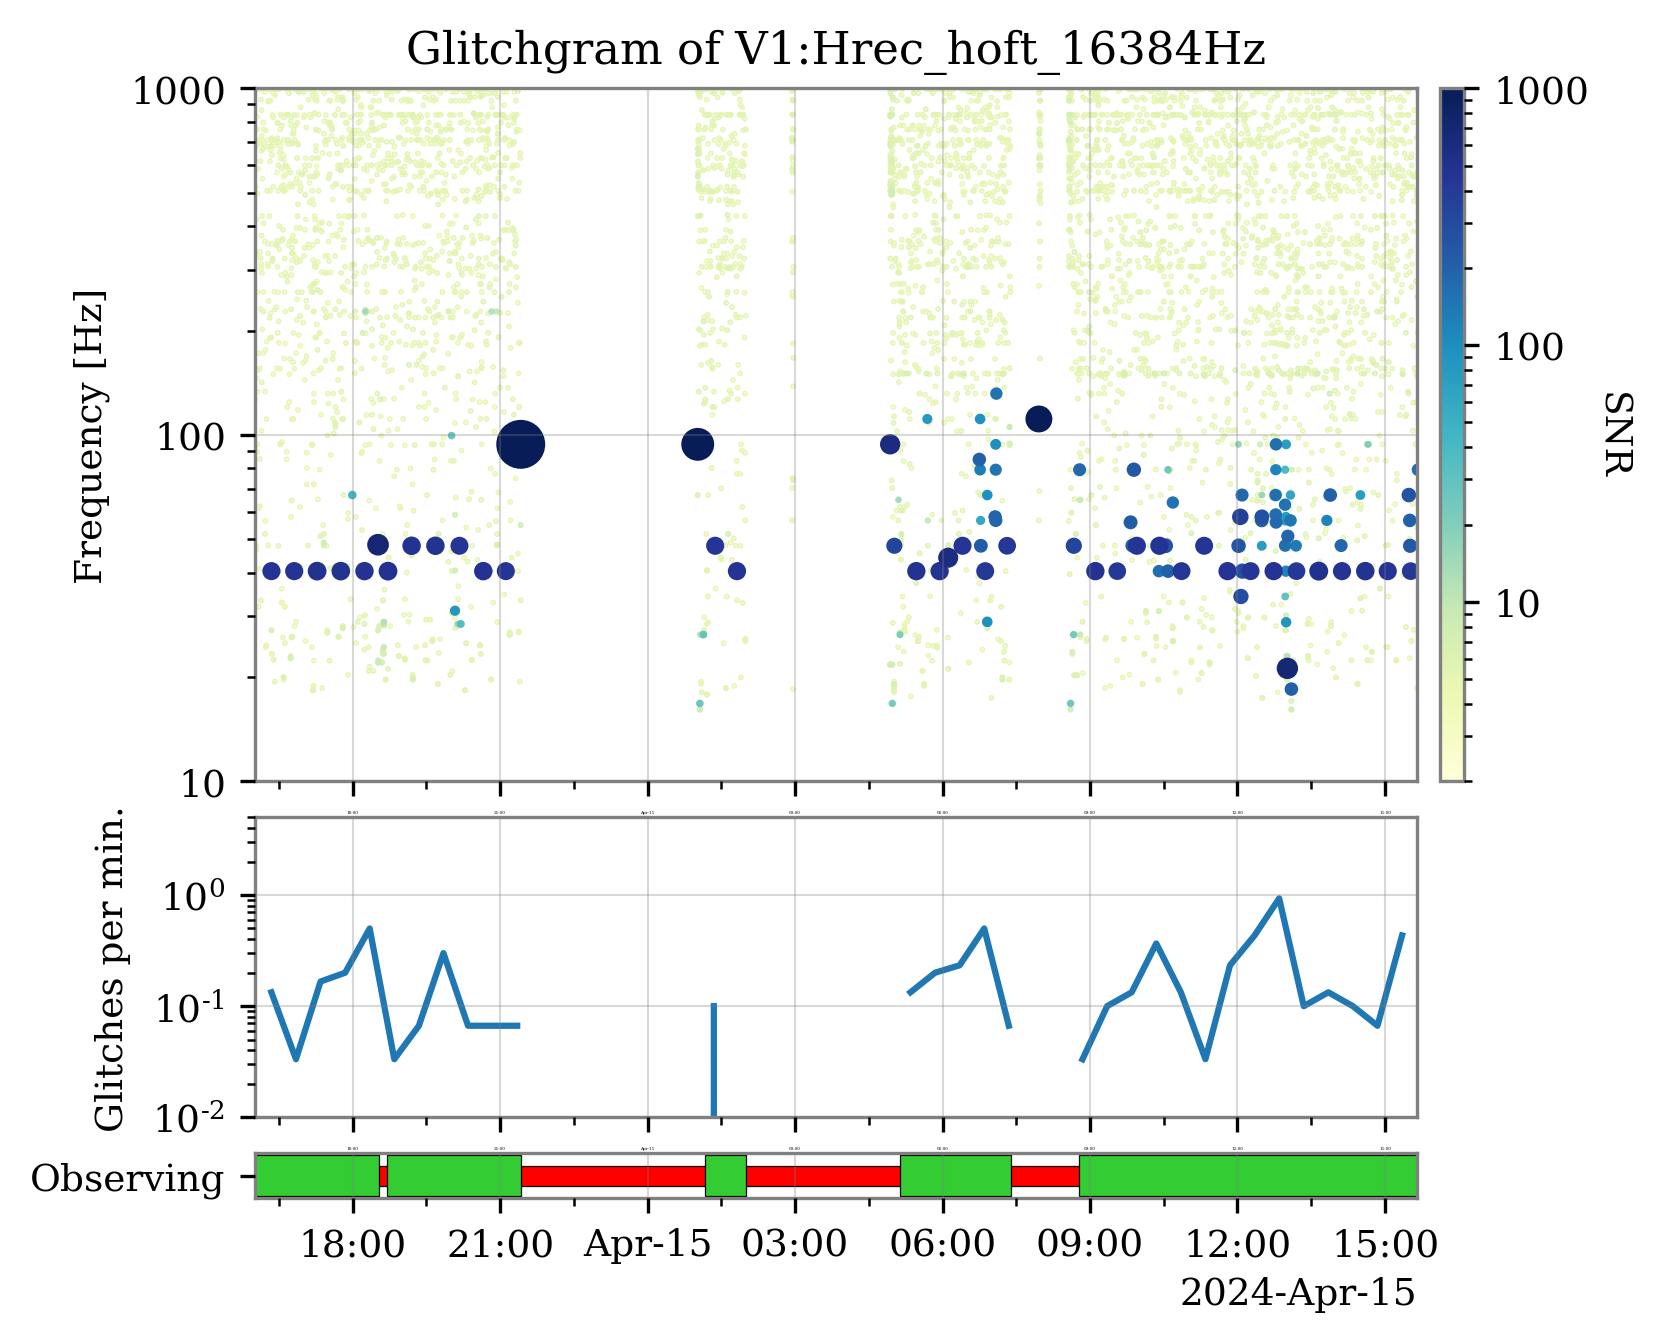
I'm investigating this issue, without much success for the moment. From the point of view of data analysis, they are not a major problem, as long as their duration is short, their number/rate remains low enough, and they are just glitches, not increased baseline noise. I add just a couple of plots to motivate the previous statements.
Figure 1: glitchgram showing the omicron triggers of the last 24 hours. The bottom plot shows their rate, which remains under control and below the 1-per-minute level (the one from O3).
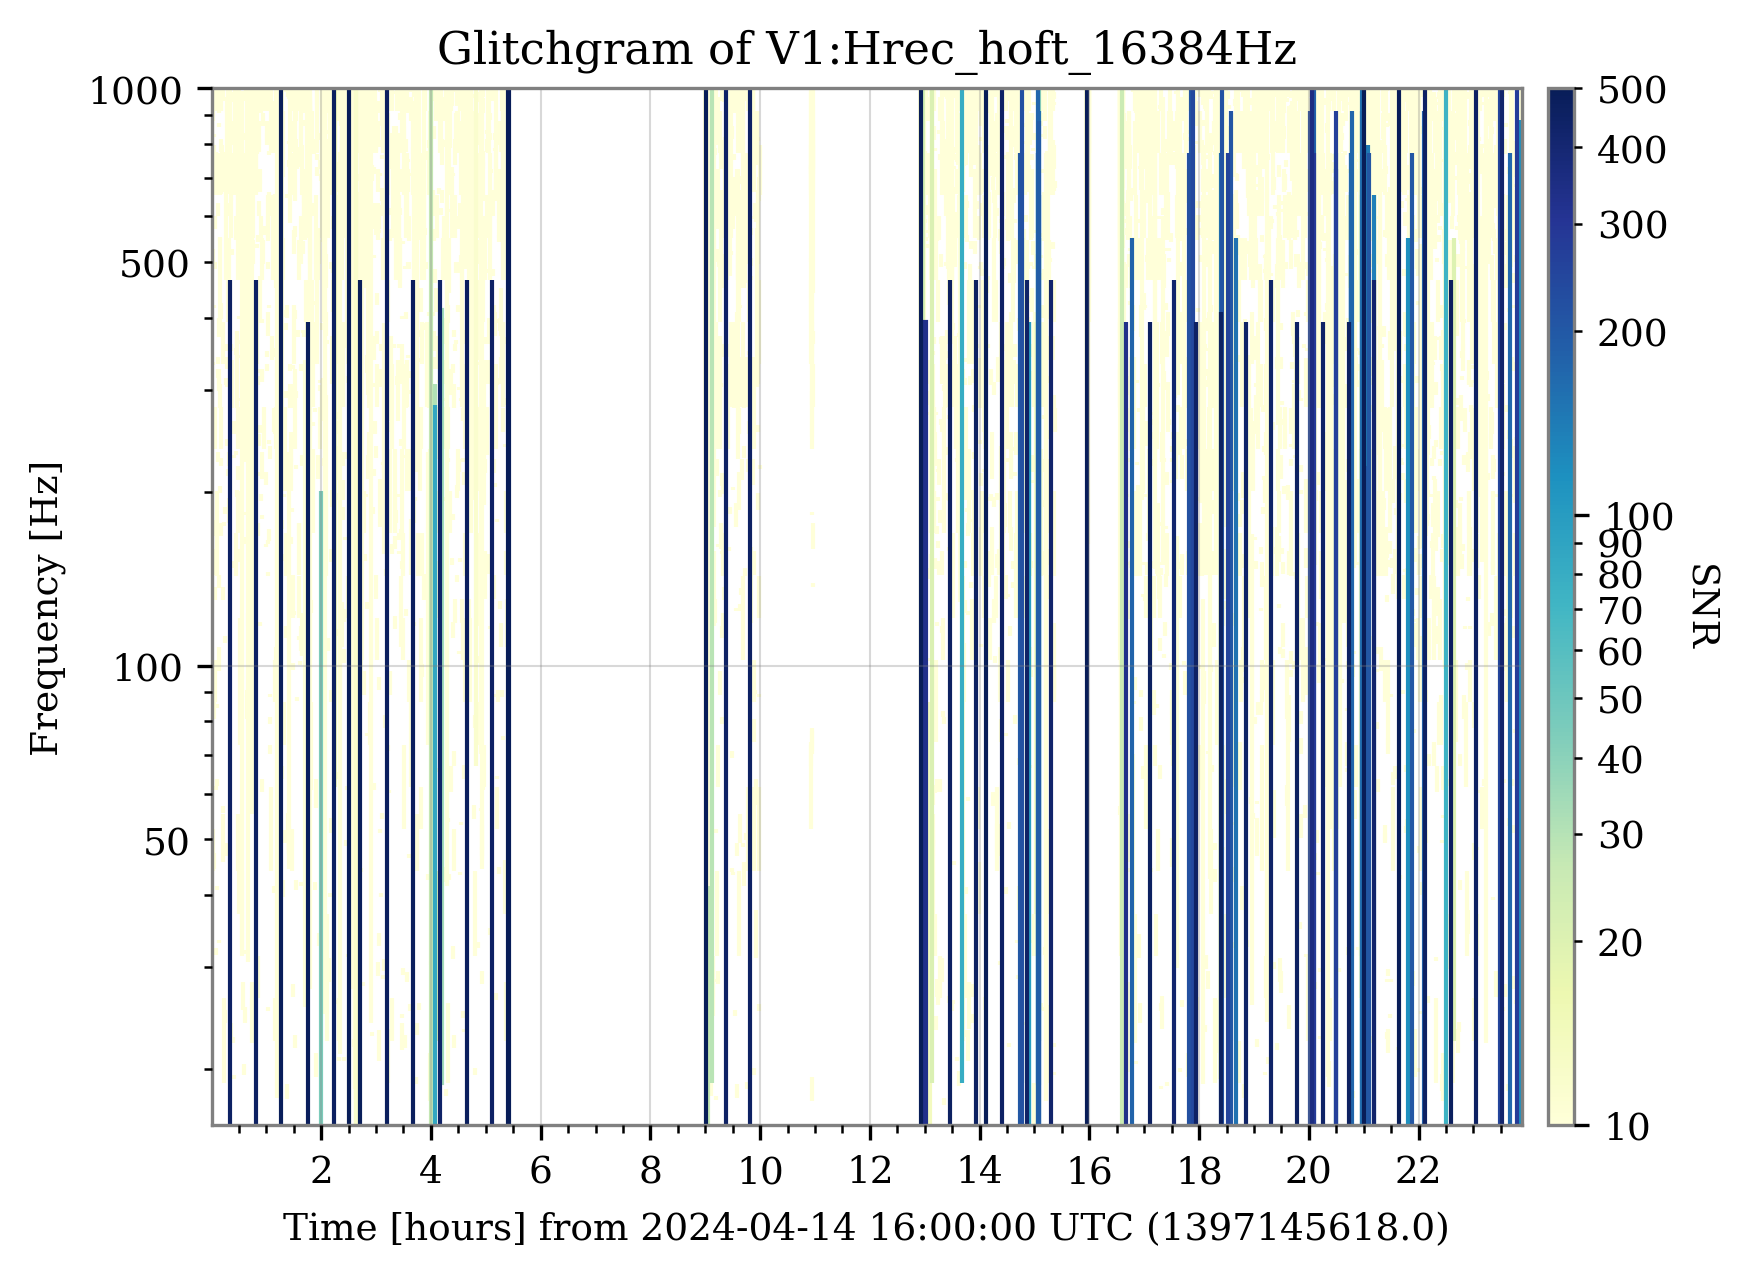
Figure 2: "rectanglegram" showing, in addition to the previous plot, the frequency extent of each glitch.
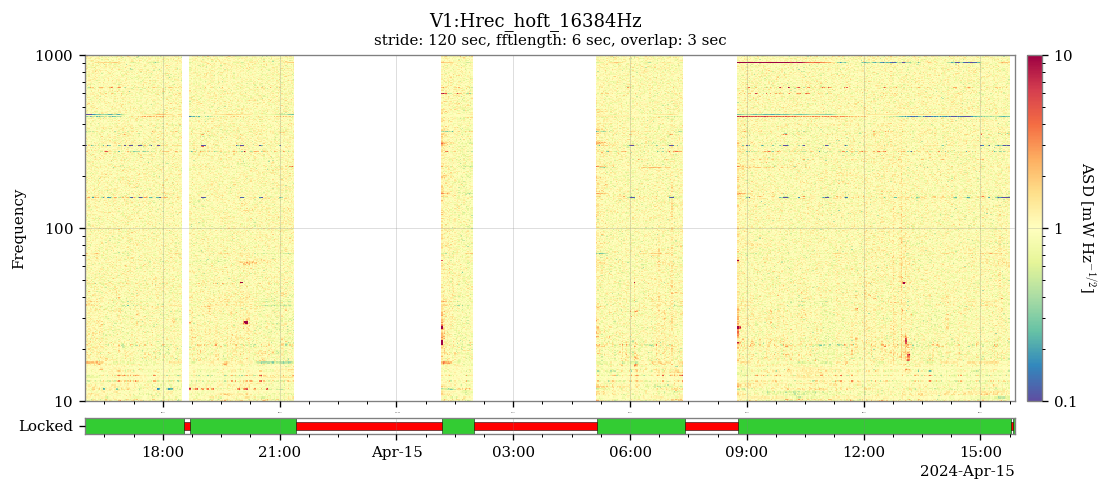
Figure 3: median normalized spectrogram to show that the noise level has remained on average the same, despite the presence of these new glitches.
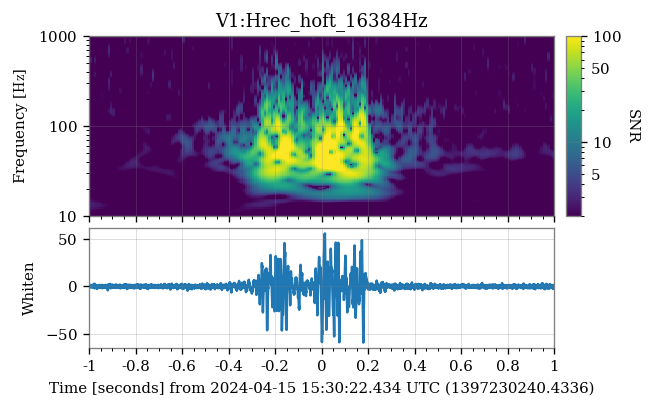
Figure 4: spectrogram of one of these glitches. They are quite different from the infamous 25-minute ones, and present a repeated excess energy structure.
I will follow up with some correlation study results (hopefully).


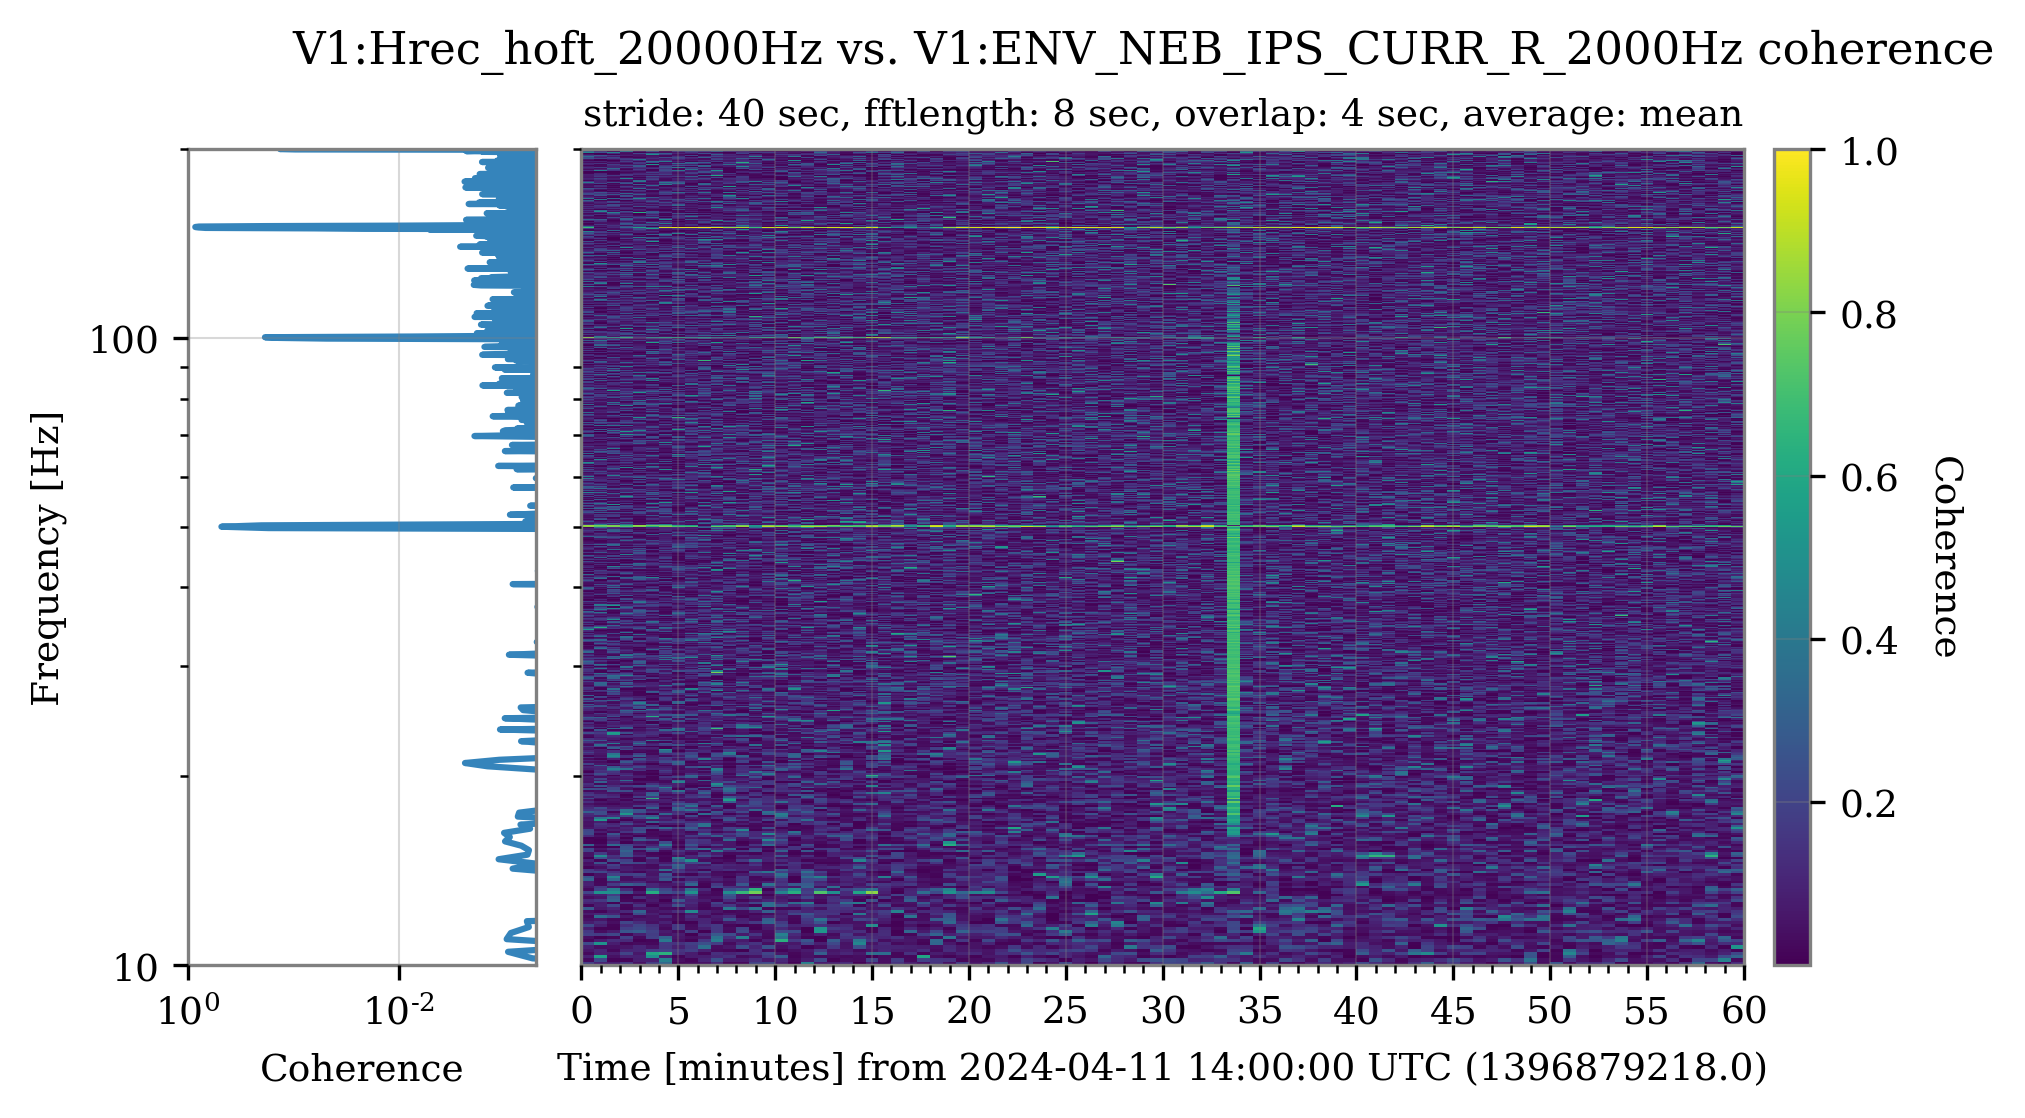
It seems that the coherence estimation by BruCo got fooled by one of the 25-minute glitches, happening at the end of the analyzed interval, UTC 14:20:25 2024/4/11 + 900 s. The glitch is recorded by omicron at 14:33:39.68. So, the spectral estimation is biased: don't trust this result.
The coherence mis-estimation is documented in this git issue.
Figure 1: coherence spectrogram of 1 hour of data around the interval of yesterday BruCo run. The effect of the glitch is visible at 14:33 UTC as an excess of coherence. The left-hand side panel shows the estimated coherence in the 1-hour interval using the median method, which is more robust to glitches. Except for the 50 Hz line and its harmonics, no suspect coherence value is visible. Since v3r2, BruCo has available the --medianpsdestimation option to estimate the spectrum using the median instead of the average (Welch method).
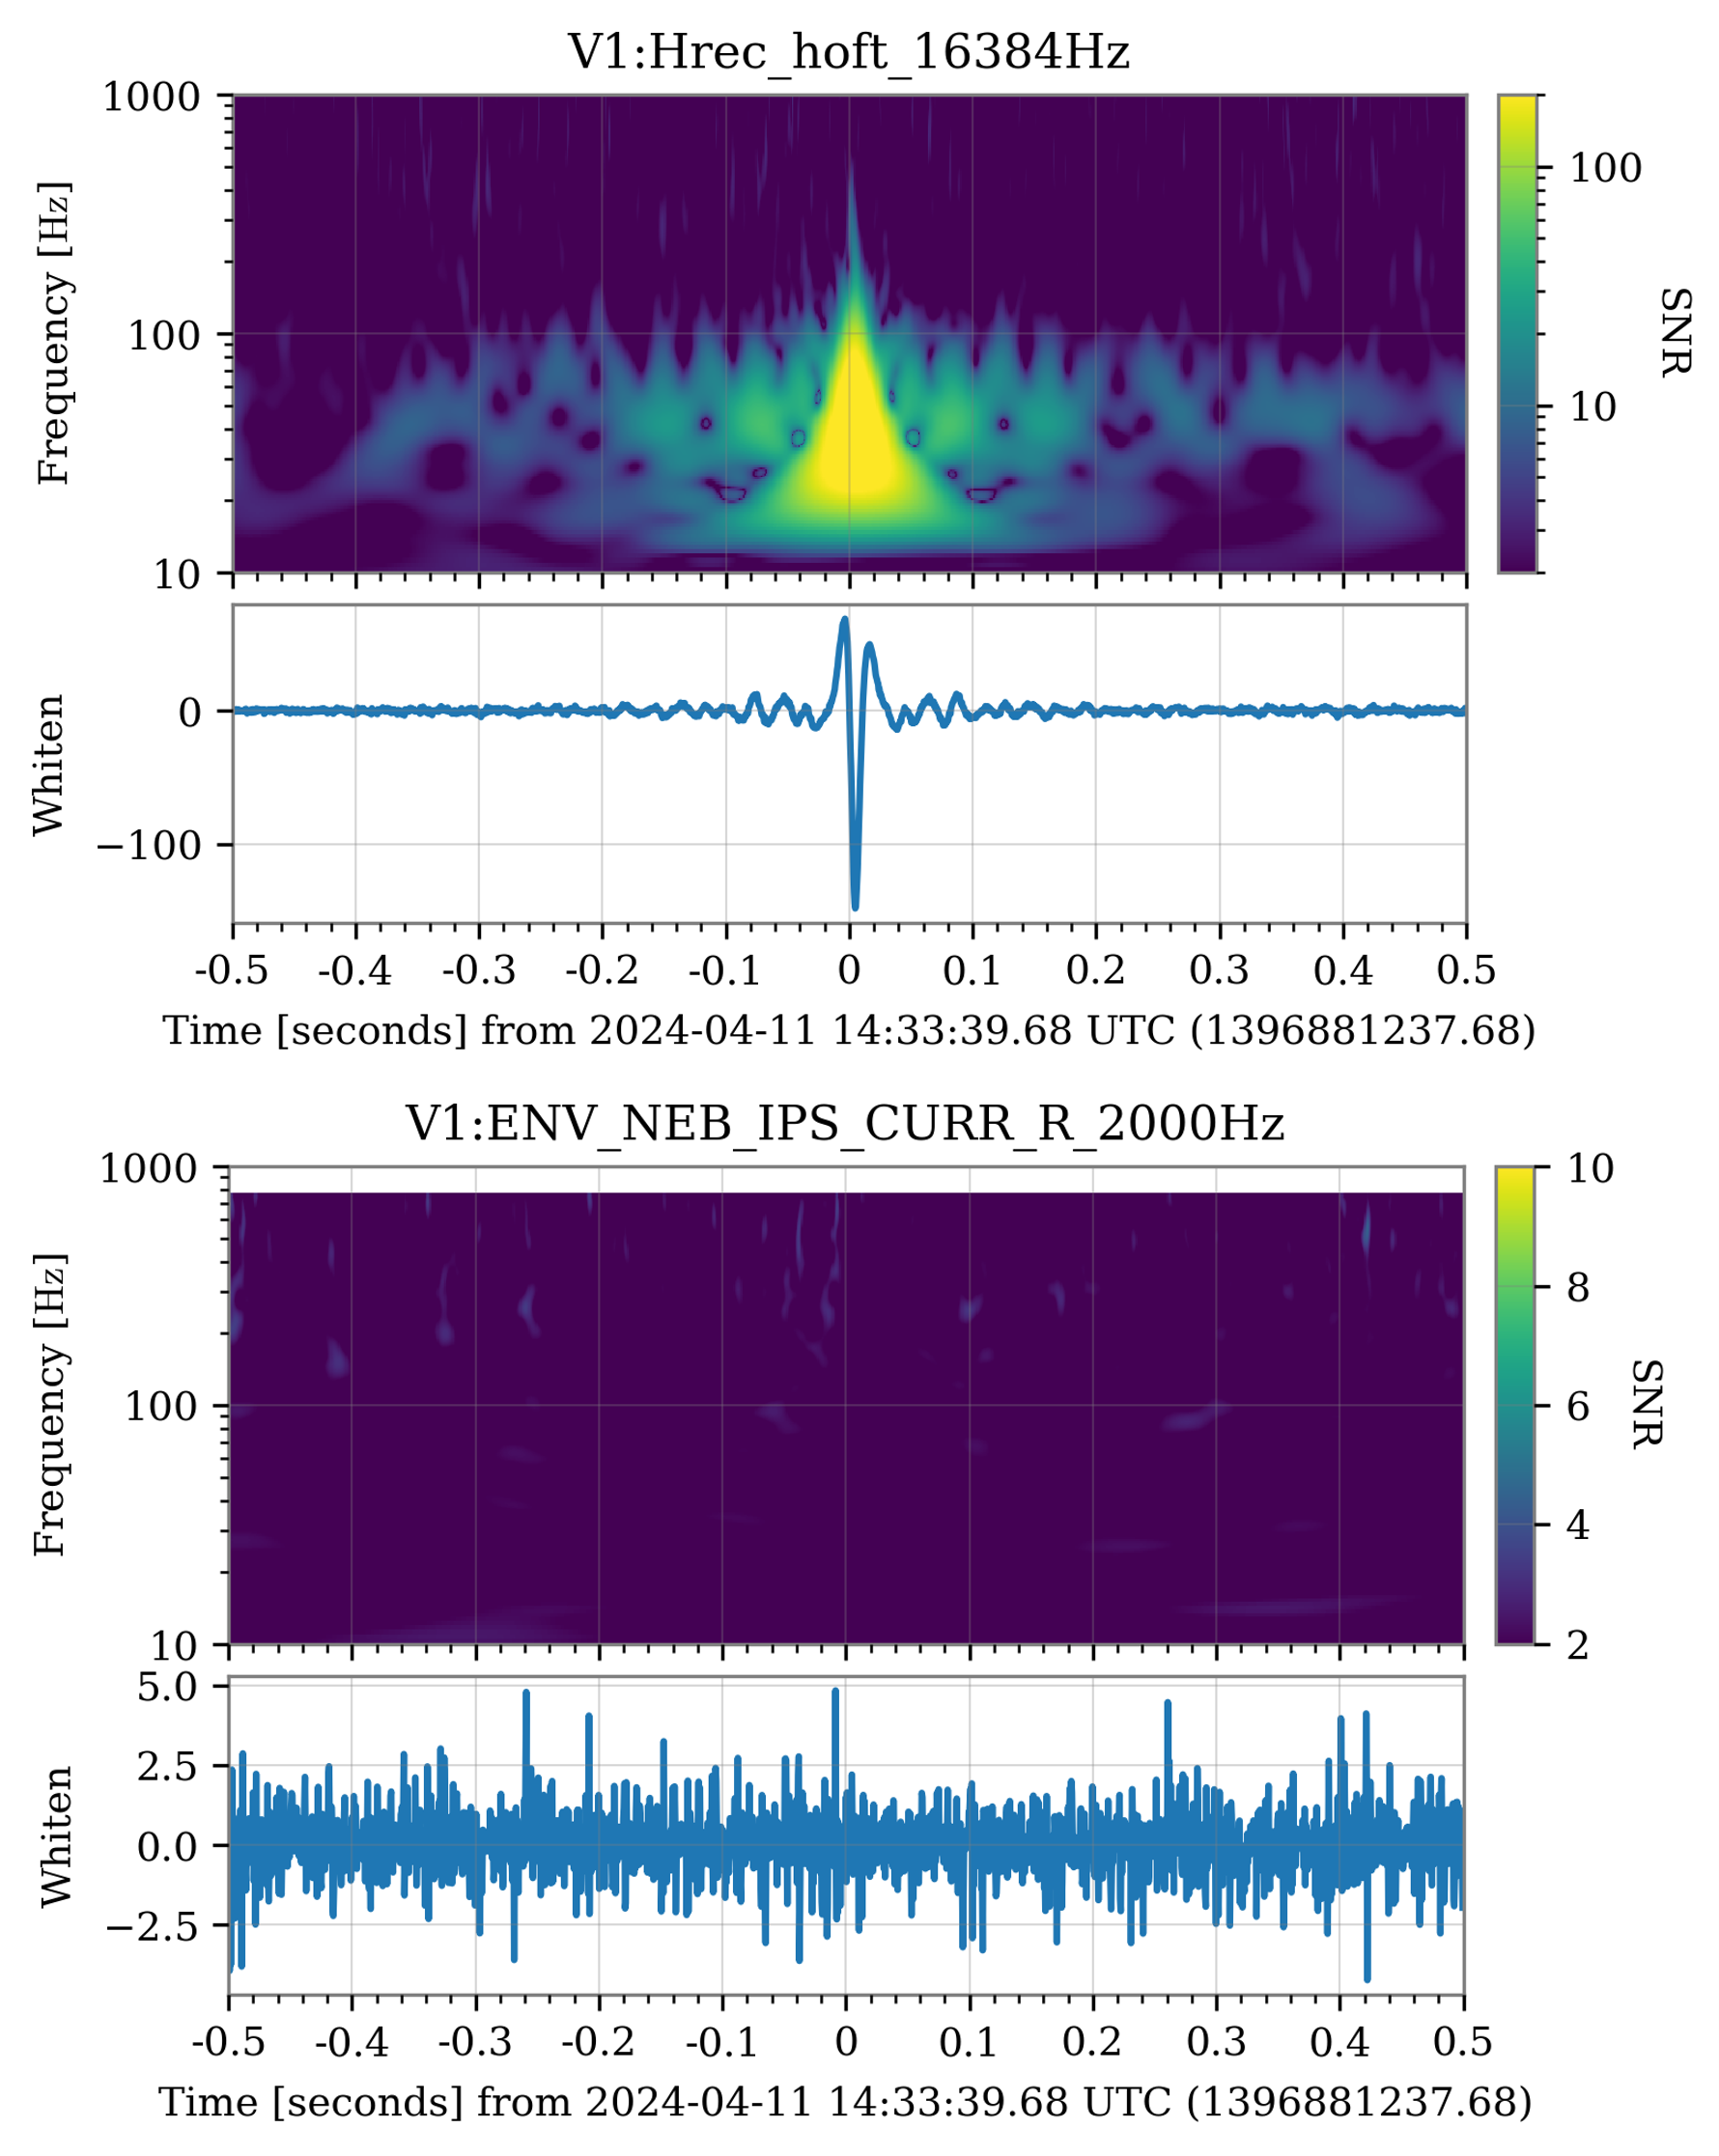
Figure 2: Q-scan and whiten time series of Hrec and V1:ENV_NEB_IPS_CURR_R_2000Hz in an interval of 1 second around the time of the glitch. The current channel shows absolutely no excess noise.
But then why the coherence between the two?
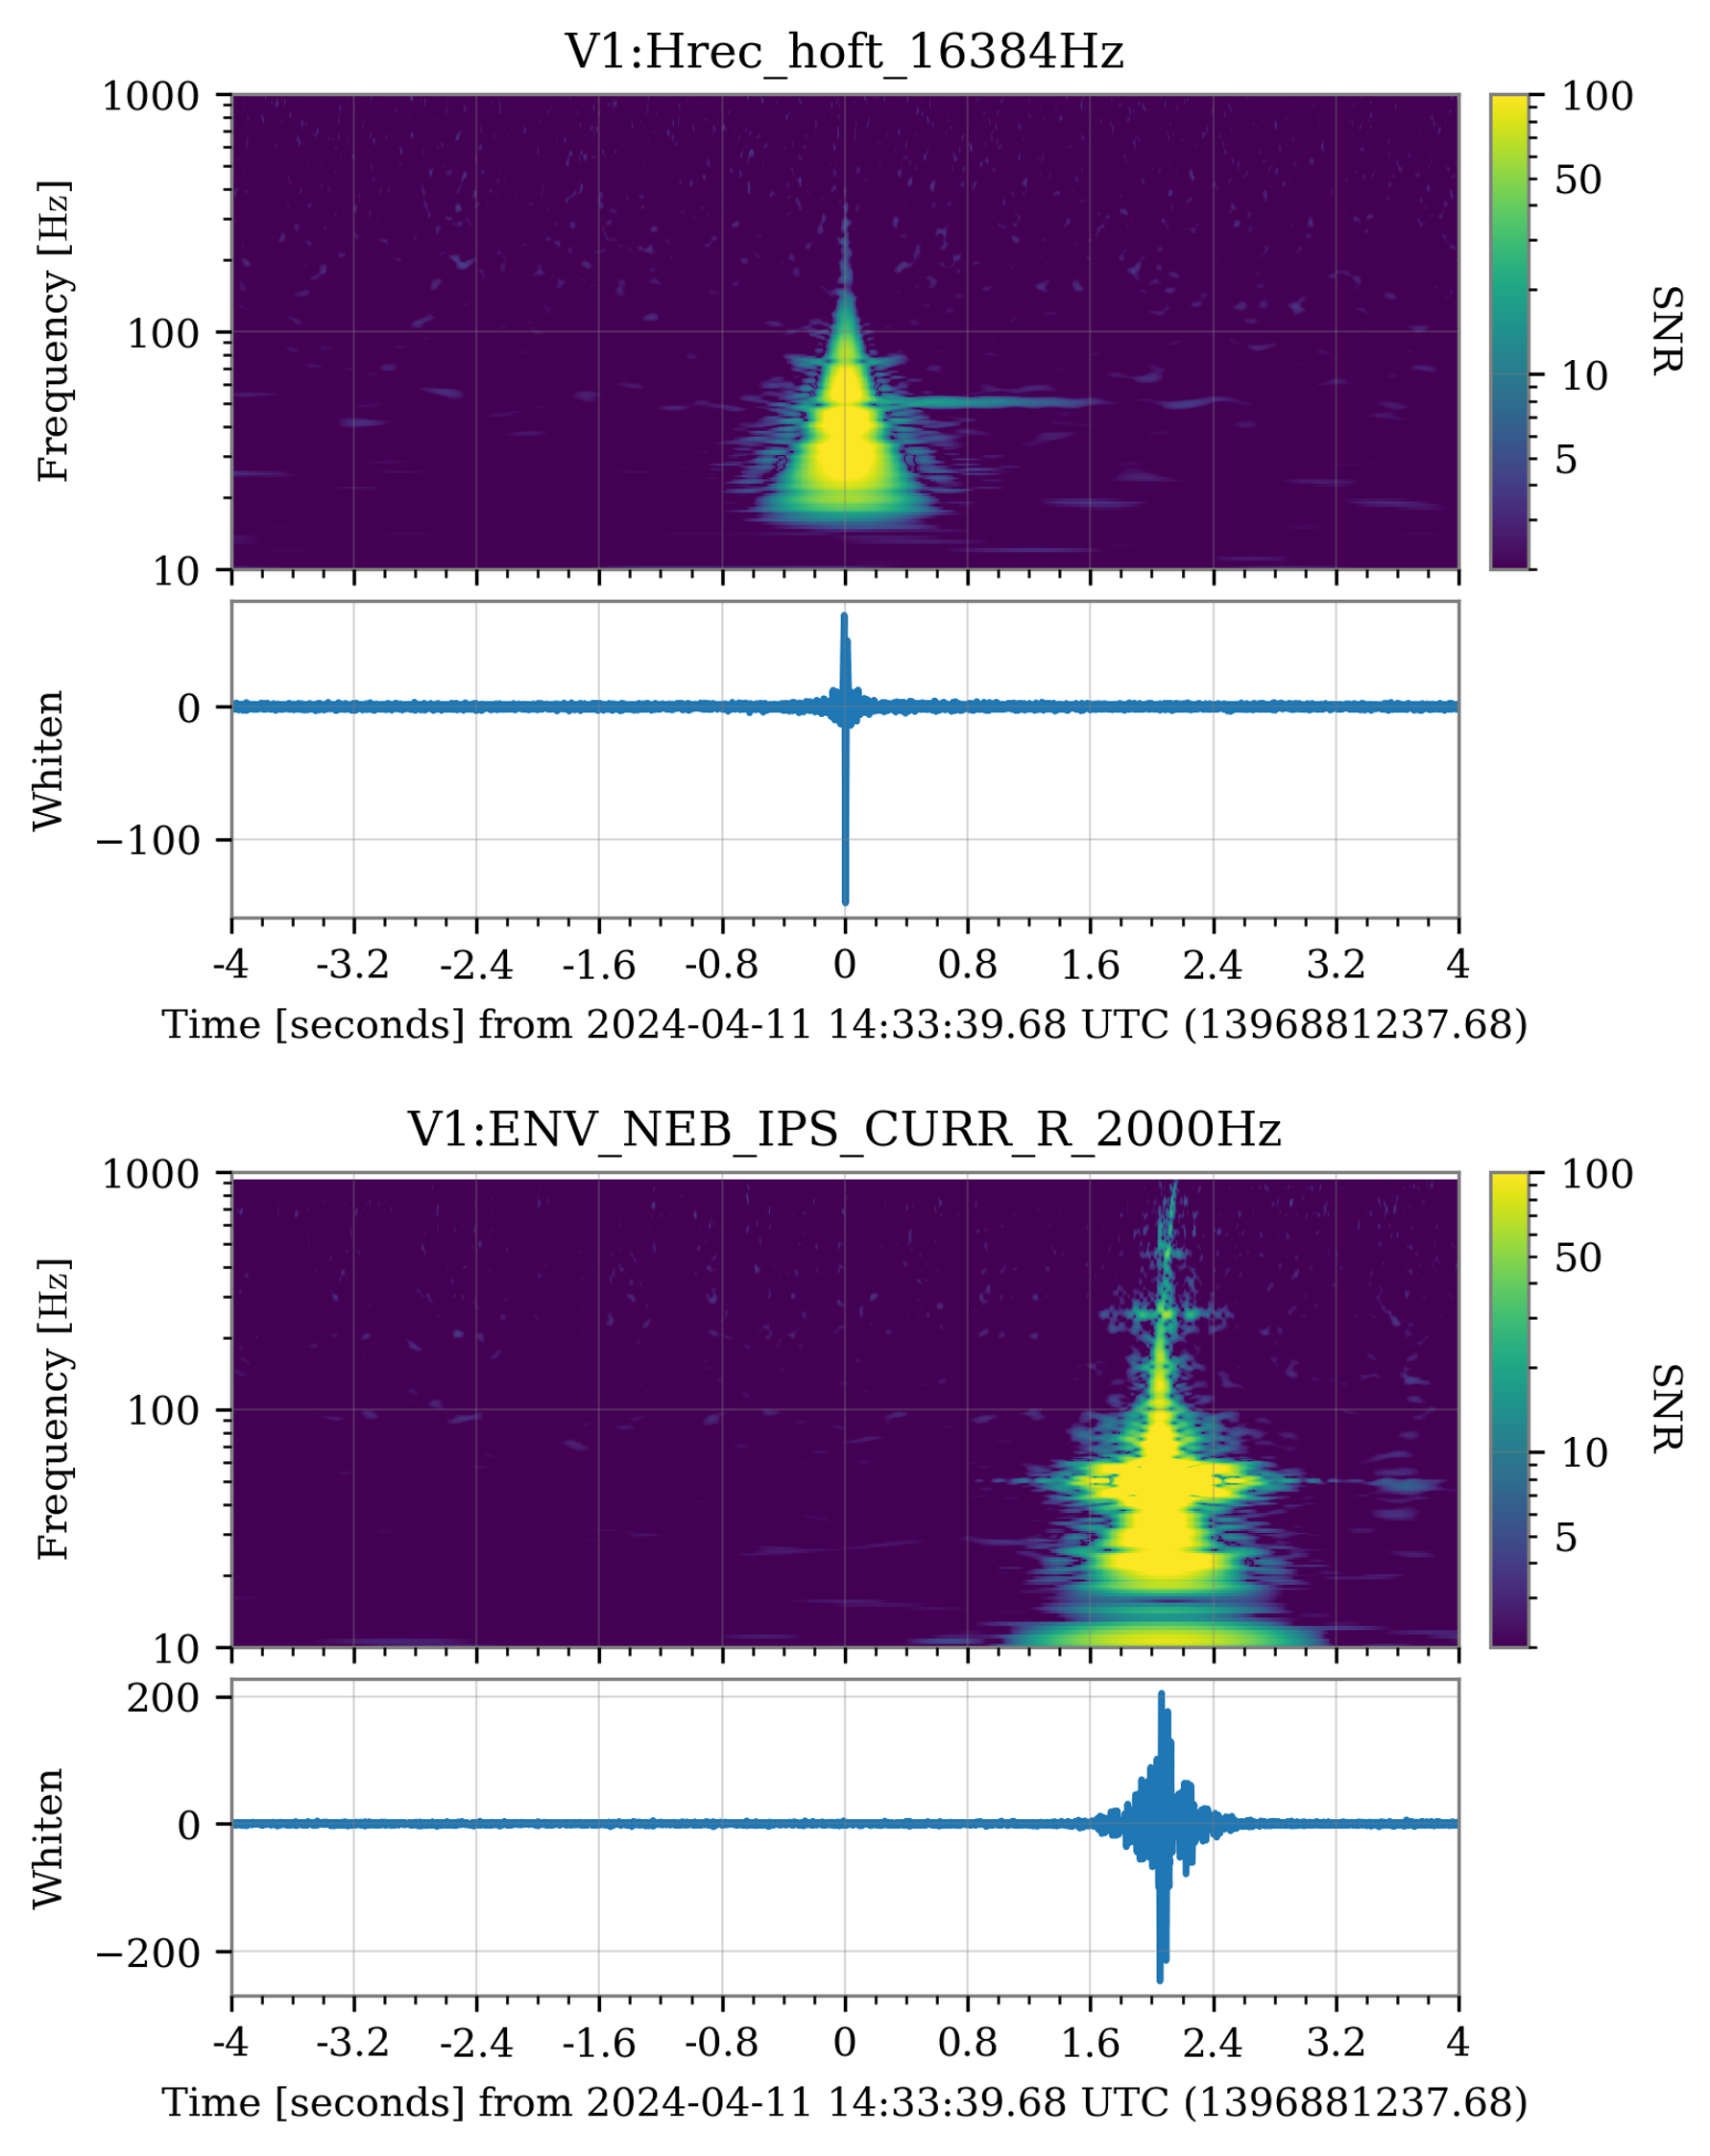
Figure 3: there is in fact a glitch in V1:ENV_NEB_IPS_CURR_R_2000Hz 2 seconds after that in Hrec, and of a vaguely similar shape, as visible from the spectrograms. The similarity in the spectrum has triggered a larger coherence value in the time bin of figure 1 embracing both glitches.
To confirm that this occurred just by chance, I plotted the spectrograms for other 25-minute glitches for both Hrec and V1:ENV_NEB_IPS_CURR_R_2000Hz. For all, no glitches in the latter channel have been observed.
Figure 4: Q-scans of Hrec and V1:ENV_NEB_IPS_CURR_R_2000Hz for another glitch belonging to the 25-minute family.


The 47-48 lines are resonances of the NI and WE F7 crossbars: #48183. They can be excited by magnetic injections (#61781), and more difficultly reduced (Ref. #61751). To be checked if some change has happened that may have caused an increase in their values.
We have analysed all the raw channels with units of position, speed and acceleration, transforming them to reproduce the frequencies of the arches. The results confirm the V1:SBE_EIB_GEO_* family as the channels that reproduce best the frequency of the arches in LSC_SRCL. Speed and acceleration channels are not good predictors of these arches.
In the attachments, three text files with the most correlated position channels (truncated to Pearson correlation values larger than 0.1), speed and acceleration channels (truncated to 0.04).
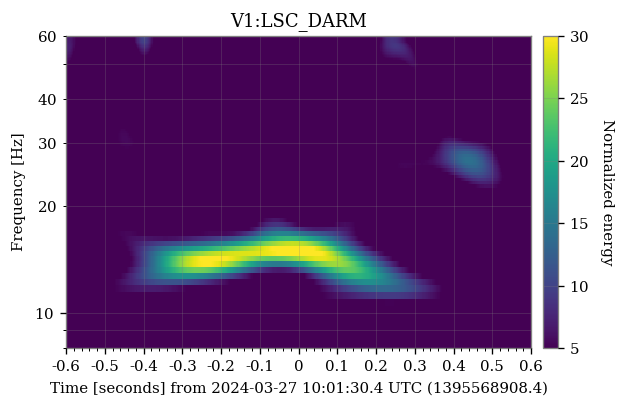
As already happened a few weeks ago, #63420, associated with the bad weather conditions of this morning and the large microseismic noise, there was an increased rate of scattered light glitches, best witnessed by LSC_SRCL, and reproduced by the V1:SBE_EIB_GEO_H2_200Hz channel.
Figure 1: spectrogram of a scattered light glitch in LSC_DARM.
Figure 2: Top: spectrogram of several scattered light glitches in LSC_SRCL. Middle: extracted arch frequency and predicted frequency of the scatterer surface according to the equation , with
the laser frequency,
the speed of the scatterer, equals to the time derivative of SBE_EIB_GEO_H2_200Hz channel, and
the number of times stray light gets reflected back and forth between the test mass and the scatterer before it joins the main beam arXiv:2007.14876 . Notice that the y-axis is the same for both the reconstructed frequency of the arches and the predicted frequency. In the box, the value of the Pearson correlation coefficient between the two quantities, 80%. Bottom: time series of SBE_EIB_GEO_H2_200Hz.
We are currently running an extended analysis to find other correlated sensors, using the list of position, speed, and acceleration channels documented in this git issue.


We have analysed all the raw channels with units of position, speed and acceleration, transforming them to reproduce the frequencies of the arches. The results confirm the V1:SBE_EIB_GEO_* family as the channels that reproduce best the frequency of the arches in LSC_SRCL. Speed and acceleration channels are not good predictors of these arches.
In the attachments, three text files with the most correlated position channels (truncated to Pearson correlation values larger than 0.1), speed and acceleration channels (truncated to 0.04).
[For some reason, this message has remained in the Drafts, even if I received the notification that it was added to the Logbook...]
Ignore my previous entry. The highlighted channel is one of those recently added to DET, as reported in this logbook entry: #63738. I'm adding them to the excluded channels from BruCo analysis:
/data/dev/detchar/online/bruco/share/virgo_excluded_channels_Hrec_hoft.txt
EDIT: BruCo daily results for Hrec (link) have correctly excluded this channel from the analysis. Unfortunately, I forgot to edit the corresponding list for DARM, and the coherence results for the last day (link) have been dominated by the new DET channel: ignore this channel from the BruCo results.
Now, I have edited the excluded channel list for DARM too. I've opened this git issue to keep track of the various excluded channel lists and keep them up to date.
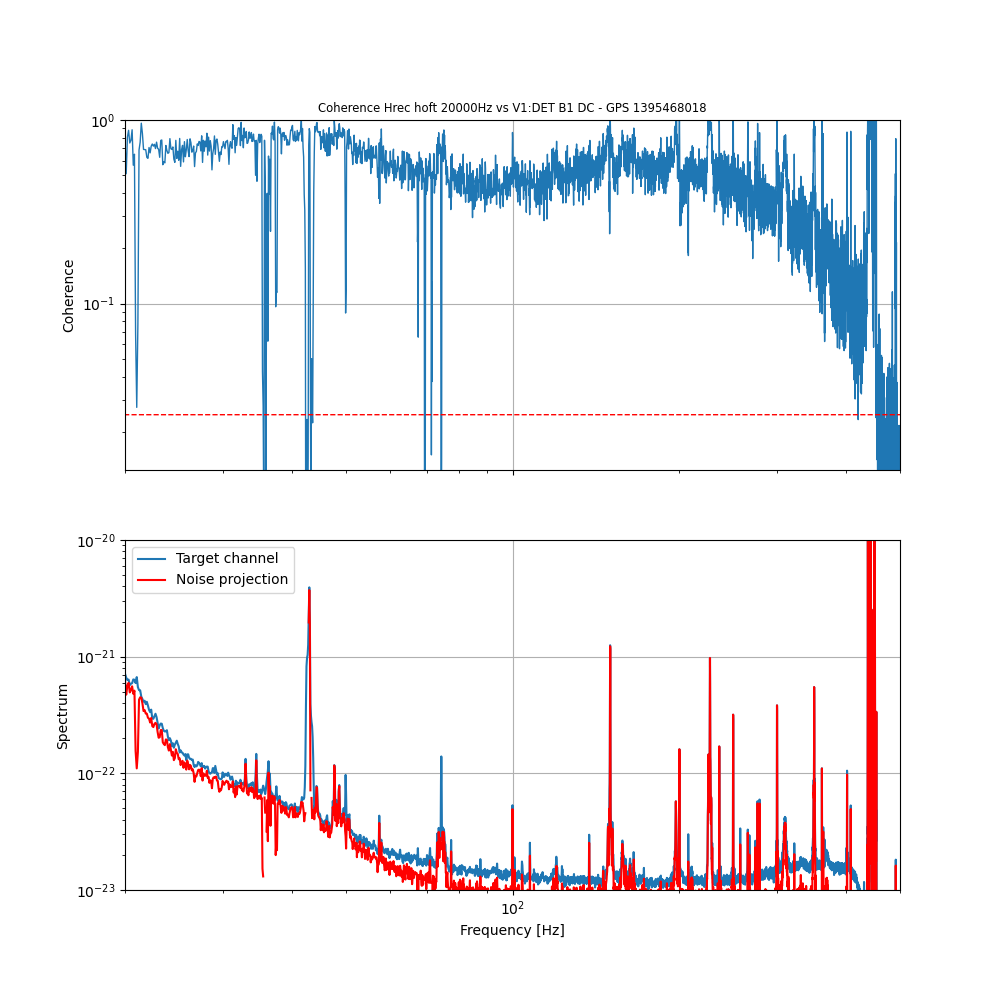
The large broadband noise up to some hundred Hz is highly coherent between Hrec and V1:DET_B1_DC, as a result of a dedicated BruCo run: link (I'm currently rerunning the script to fix the cropped y-scale). In the table, you can find also a bunch of channels coherent with the large peak at 43 Hz.
Figure 1: coherence and noise projection of V1:DET_B1_DC to Hrec.

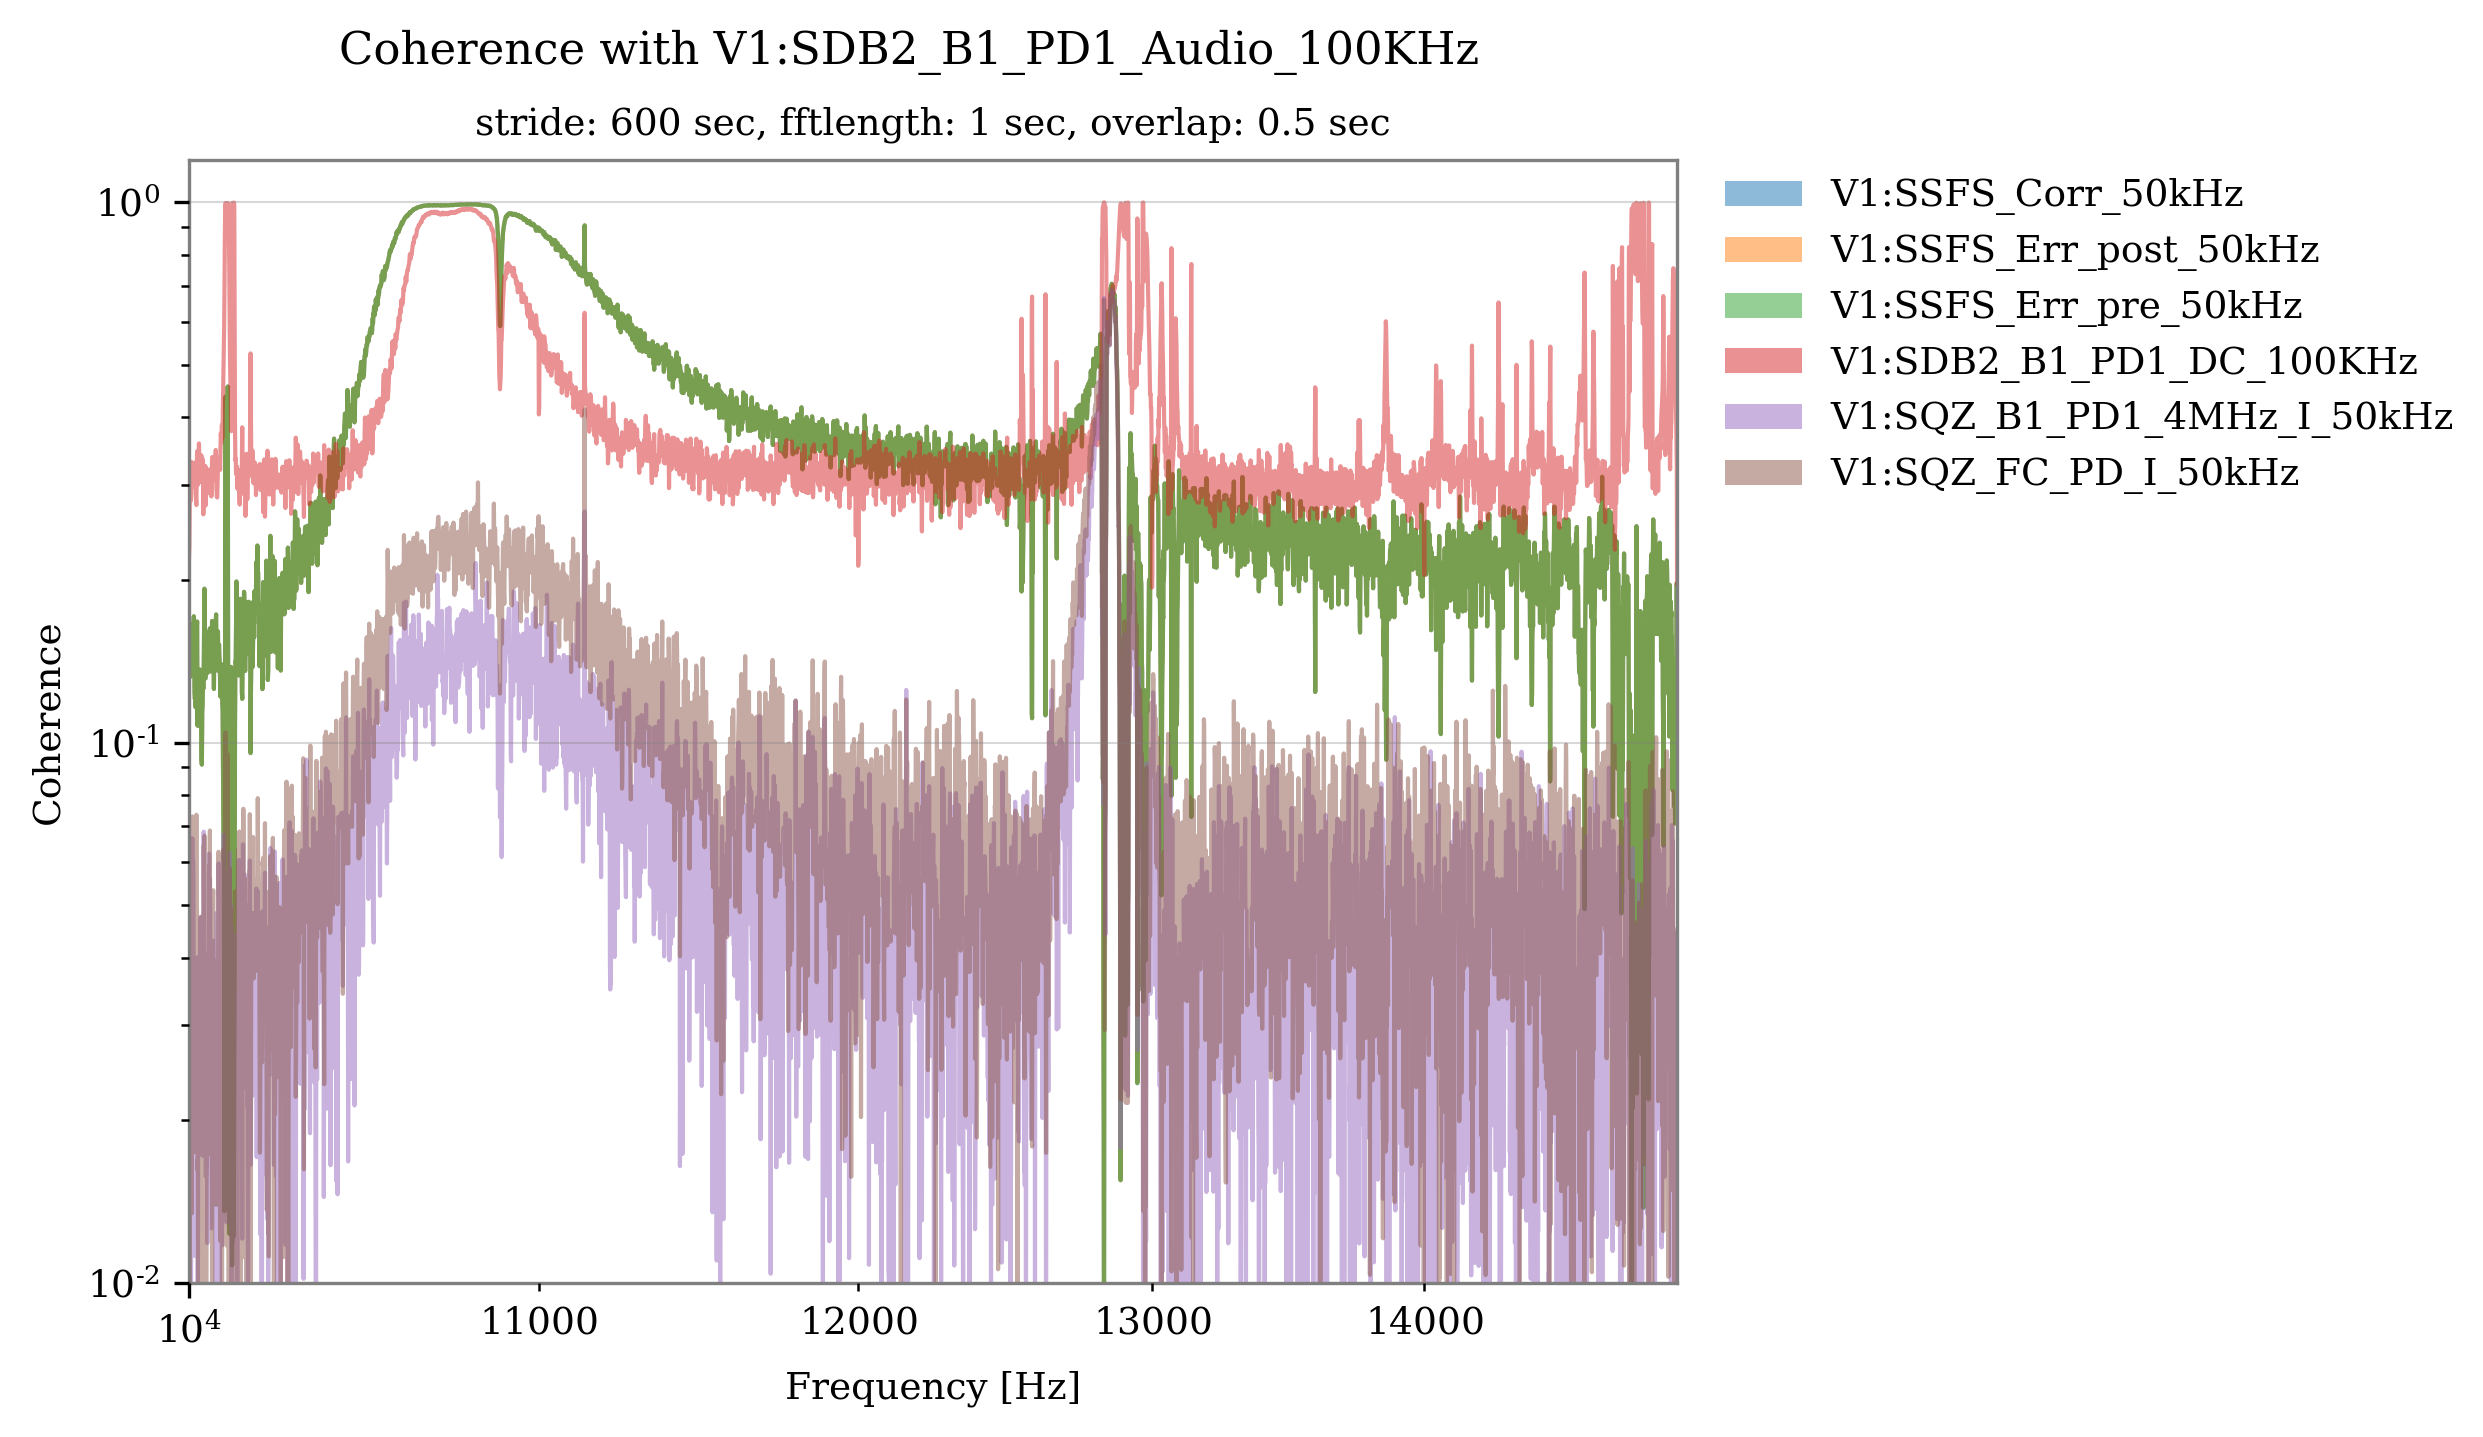
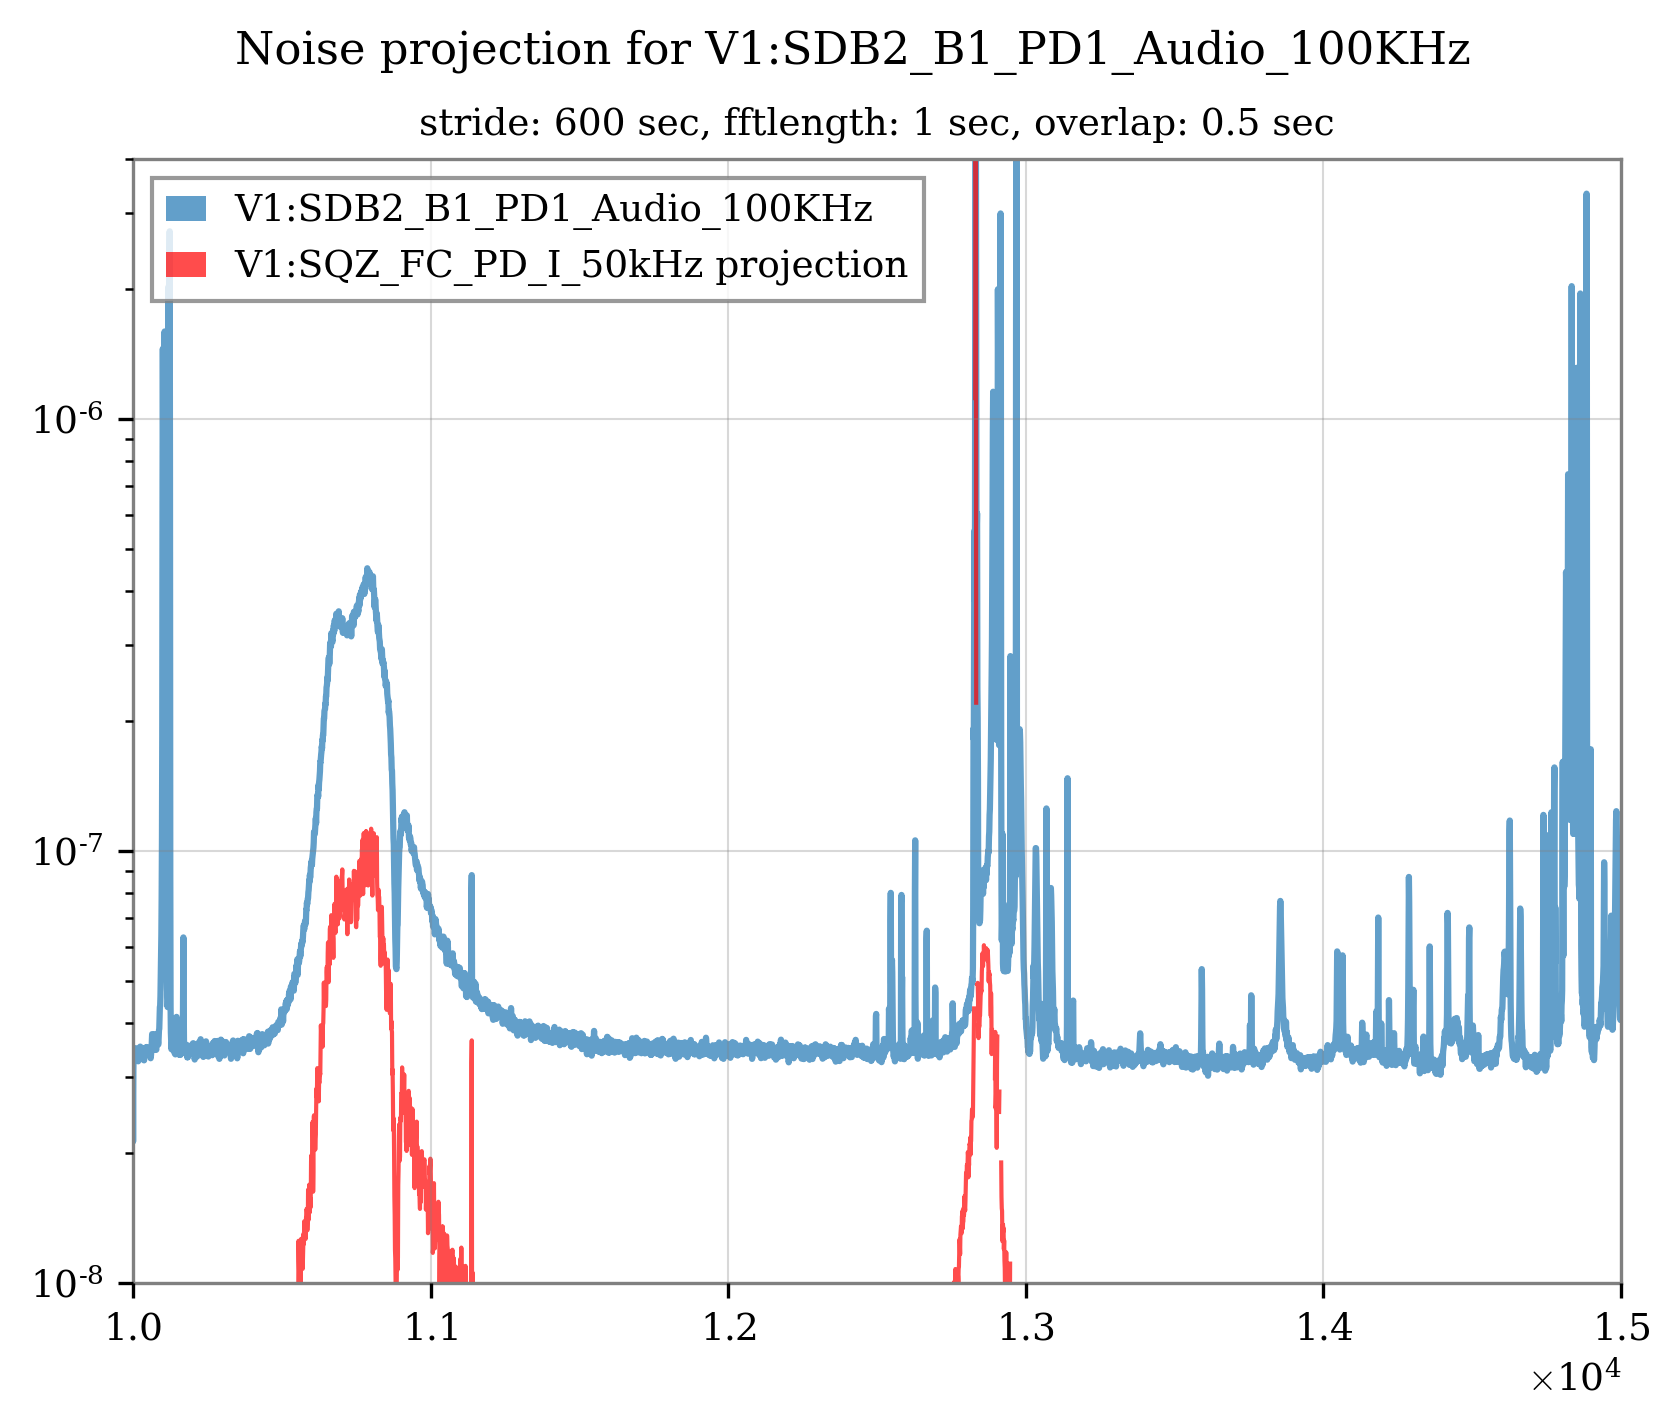
I've investigated the bump between 1.05 and 1.12 kHz by estimating the coherence of the channel V1:SDB2_B1_PD1_Audio_100KHz with all the raw channels with sampling rates larger than 20 kHz (46).
Figure 1: the 6 channels with significant coherence at the frequencies of the noise bump are shown in this figure, which represents the coherence with the target channel in the band 10-15 kHz. Some channels are clearly interdependent and naturally correlated with the target. I let the experts comment on how informative this result can be. Notice that the curves for V1:SSFS_Corr_50kHz and V1:SSFS_Err_*_50kHz are superimposed.
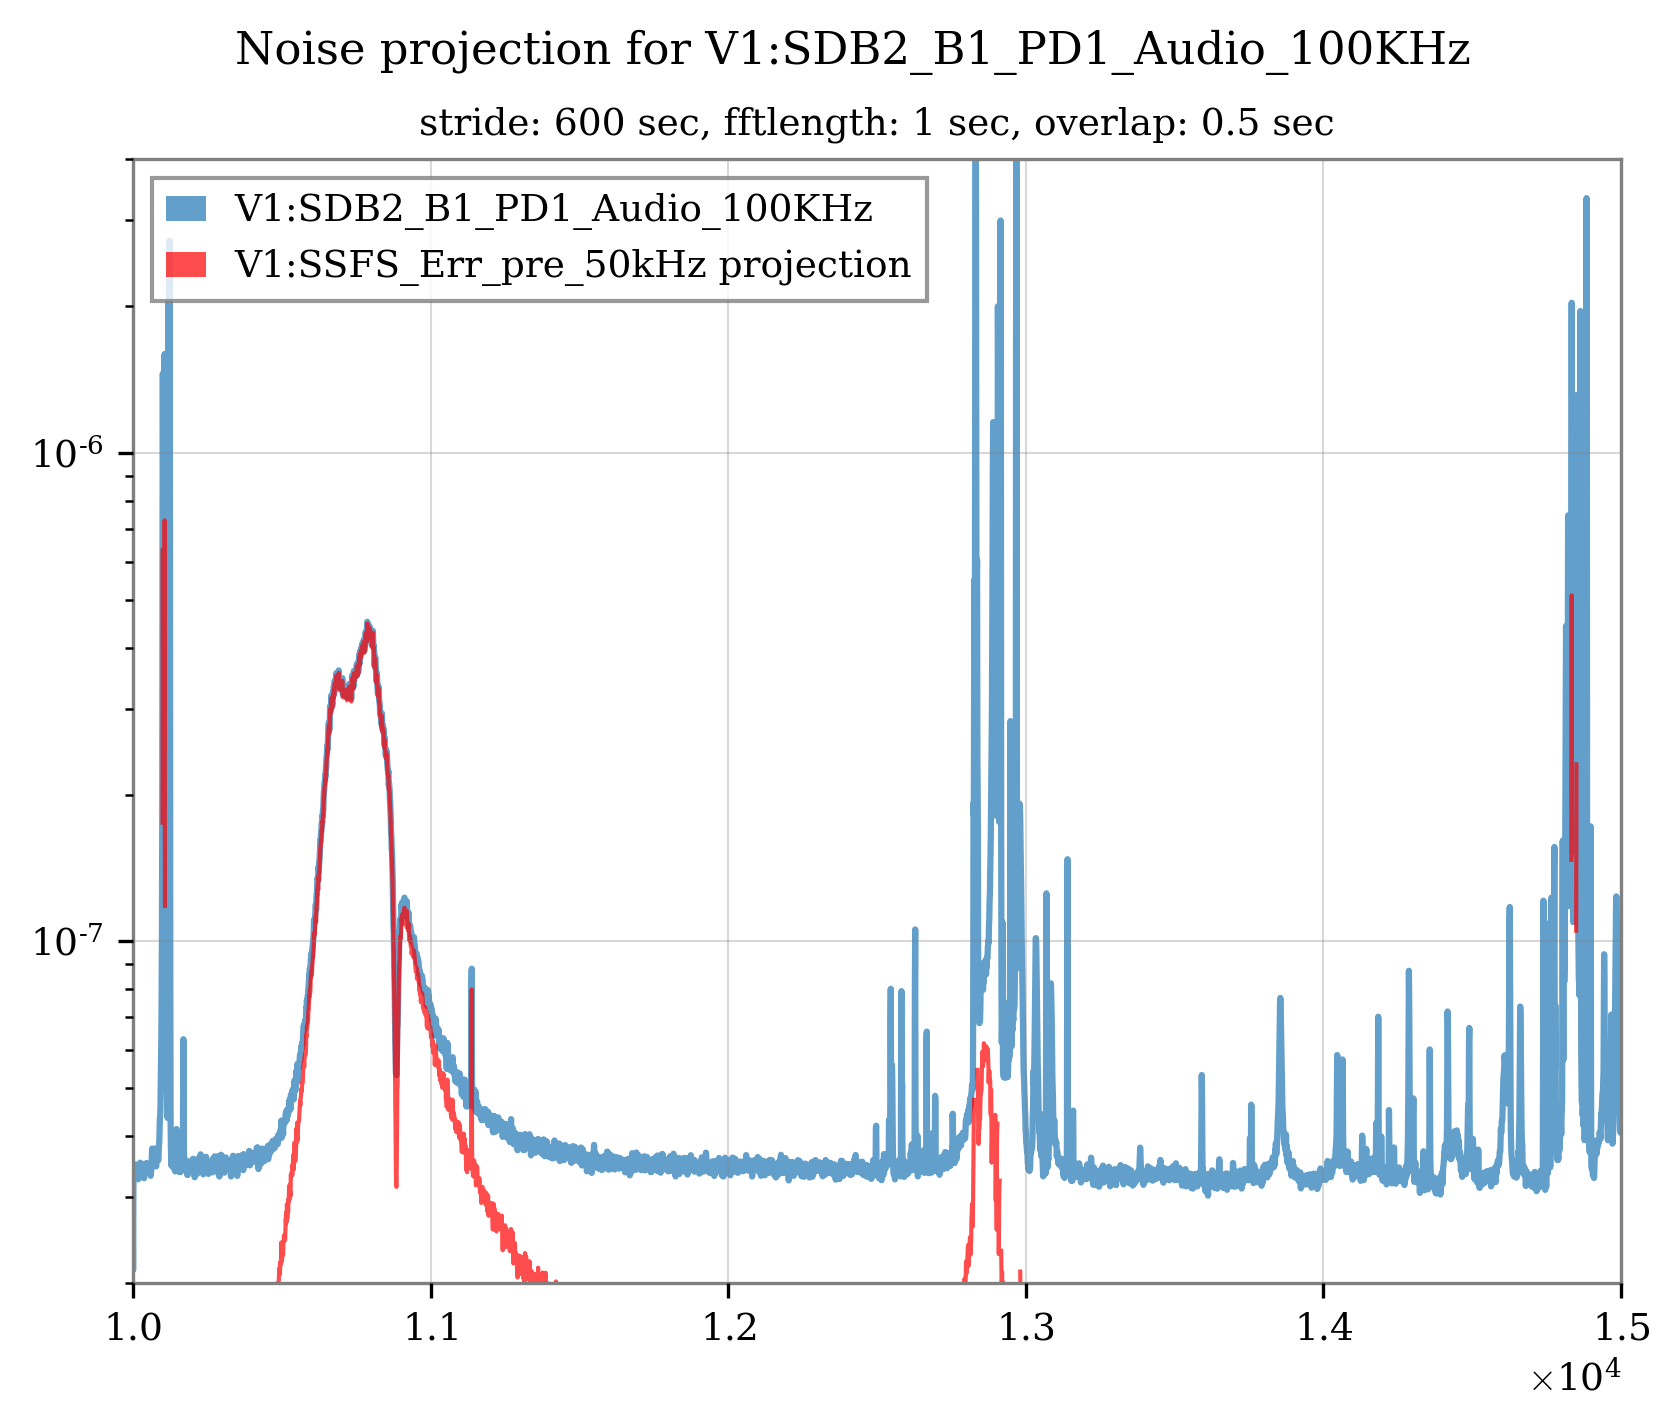
Figure 2-3: noise projections with some of the above most coherent channels (ASD vs frequency: sorry for the missing axis labels)
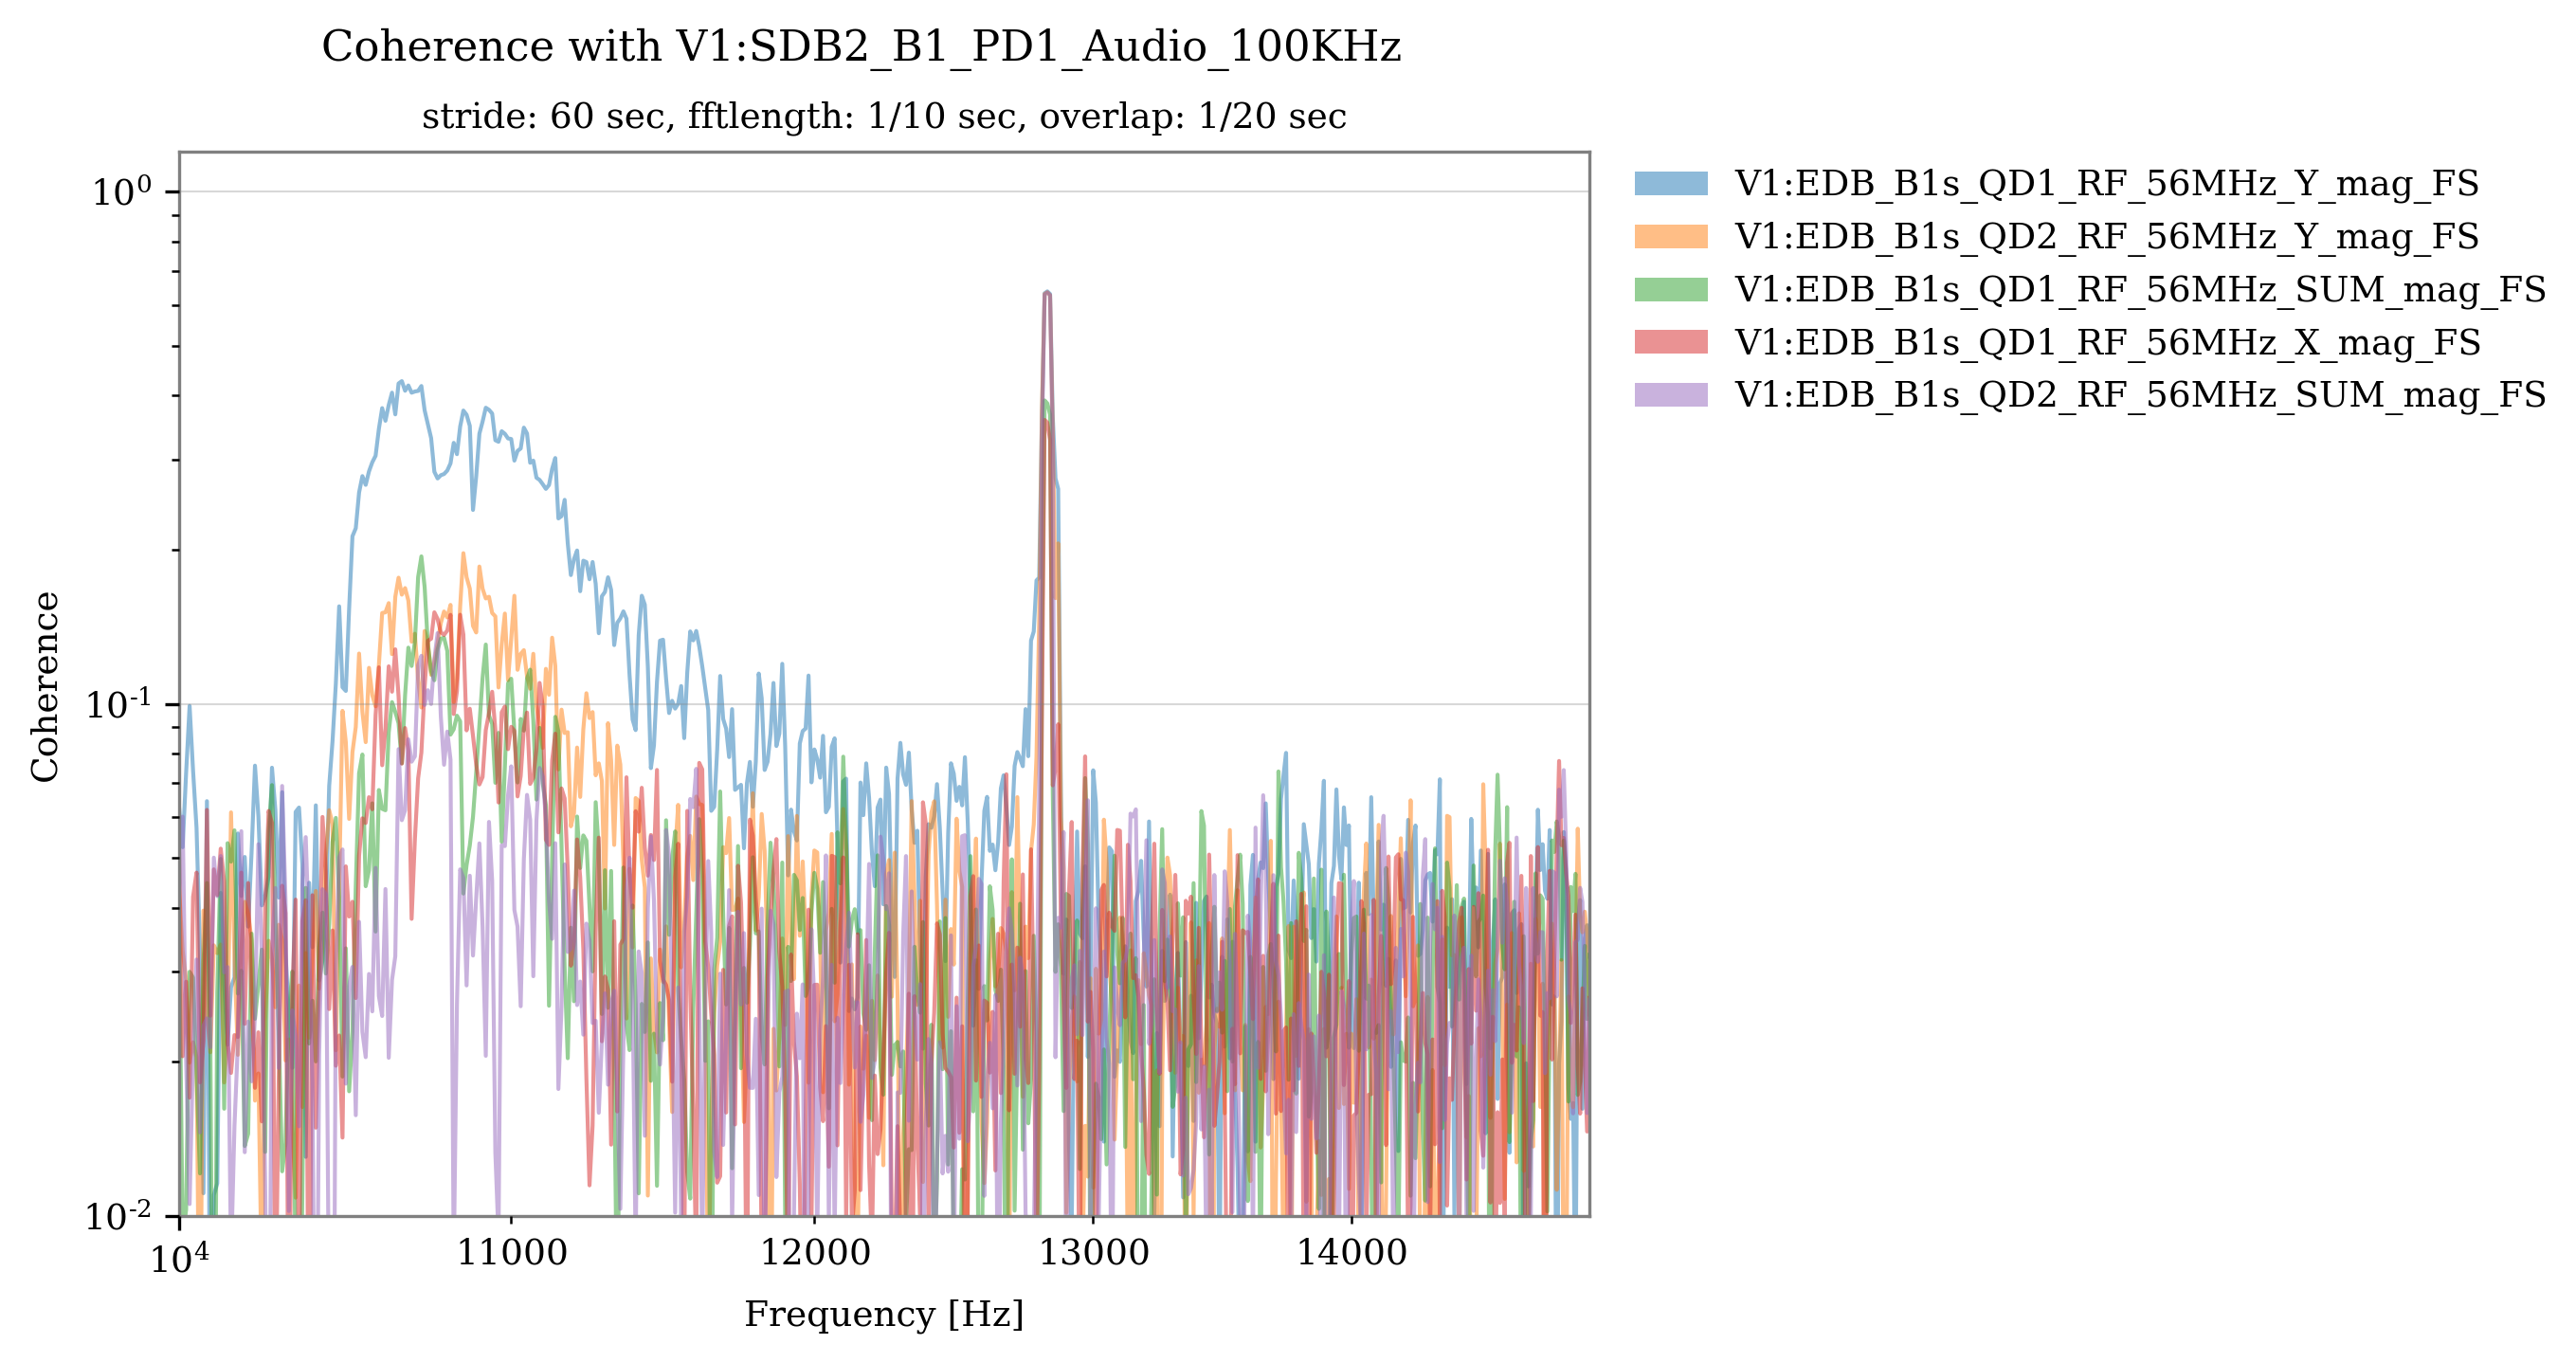
I repeated the same analysis with all the raw_full channels with a sampling rate larger than 20 kHz (247):
Figure 4: the only channels exhibiting a significant coherence with this peak in SDB2_B1_PD1 are from the V1:EDB_B1s_QD1_RF_56MHz_* family. Not shown, a small barely significant coherence has also been measured with V1:SNEB_LC_LVDT_FL_V_out_raw_DS and the V1:SIB2_LC_LVDT_*_out_raw_DS family.
Comments and suggestions are welcome on whether these results are informative and what to test next.


Unless the ticks fool me, at 20 Hz the ASD is "a little more than" , and at 40 Hz something between
and
. This means a power-law exponent between
and "a little less than" .
At these frequencies, the glitch ASD could be affected by the noise background. We can move upward and repeat the estimate around the frequencies of the maximum intensity identified by omicron triggers, which is around 40 Hz. For example, from Didier's plot, the ASD is about at 30 Hz and
at 70 Hz. This leads to a power-law exponent of -2.72.
This is somewhat midway between a step function, as explained by Michal, and an impulsive force, like a Dirac delta, whose response would have produced a power law with exponent -2. And, just looking at the math, an exponent of -2.5 could be the response of a "hyperbolic-step-function" of the form
...whatever may produce it.

Investigating the retard relation is definitely a valuable additional piece of information to the characterization of these glitches. However, the estimated delays don't seem to be correct. There is likely an issue with the glitch rate median estimation. I assume the blue curve is a running median on the distances between N consecutive glitch trigger times or the GPS times of the maxima of some Hrec BRMS time series. However, the GPS time to attribute to each estimate must correspond to the central point (ref. for example #63147) otherwise you shift your median estimates by N/2 * "25 minutes". To be more precise, the term within quotes should be the estimated running median delay itself.
In the quoted entry (#63147, fig.4), I estimated that the effect on V1:INF_TCS_NI_RH_TE is delayed by about 8 hours from the temperature measured by V1:INF_NI_BOTTOM_TE1, and the two have typical cycles of about 20 hours. (I don't know how much this delay depends on the temperature itself, as per the Stefan–Boltzmann law, but I will assume it to be negligible in this context) This is why I suspect an error in the original post on the estimated delay of the glitches and the RH TE 268.5 min, and the NI BOTTOM TE 273 min (~ 4h30). These times don't quite add up to 8 hours.
Additionally, in #63147, I "visually showed" the presence of a delay between the glitch time series and the NI BOTTOM temperature, and a much closer similarity/synchronicity with V1:INF_TCS_NI_RH_TE. Let' s reexamine this point, this time avoiding being tricked by the running median. For this reason, I compared directly the glitch distances with the temperature channels.
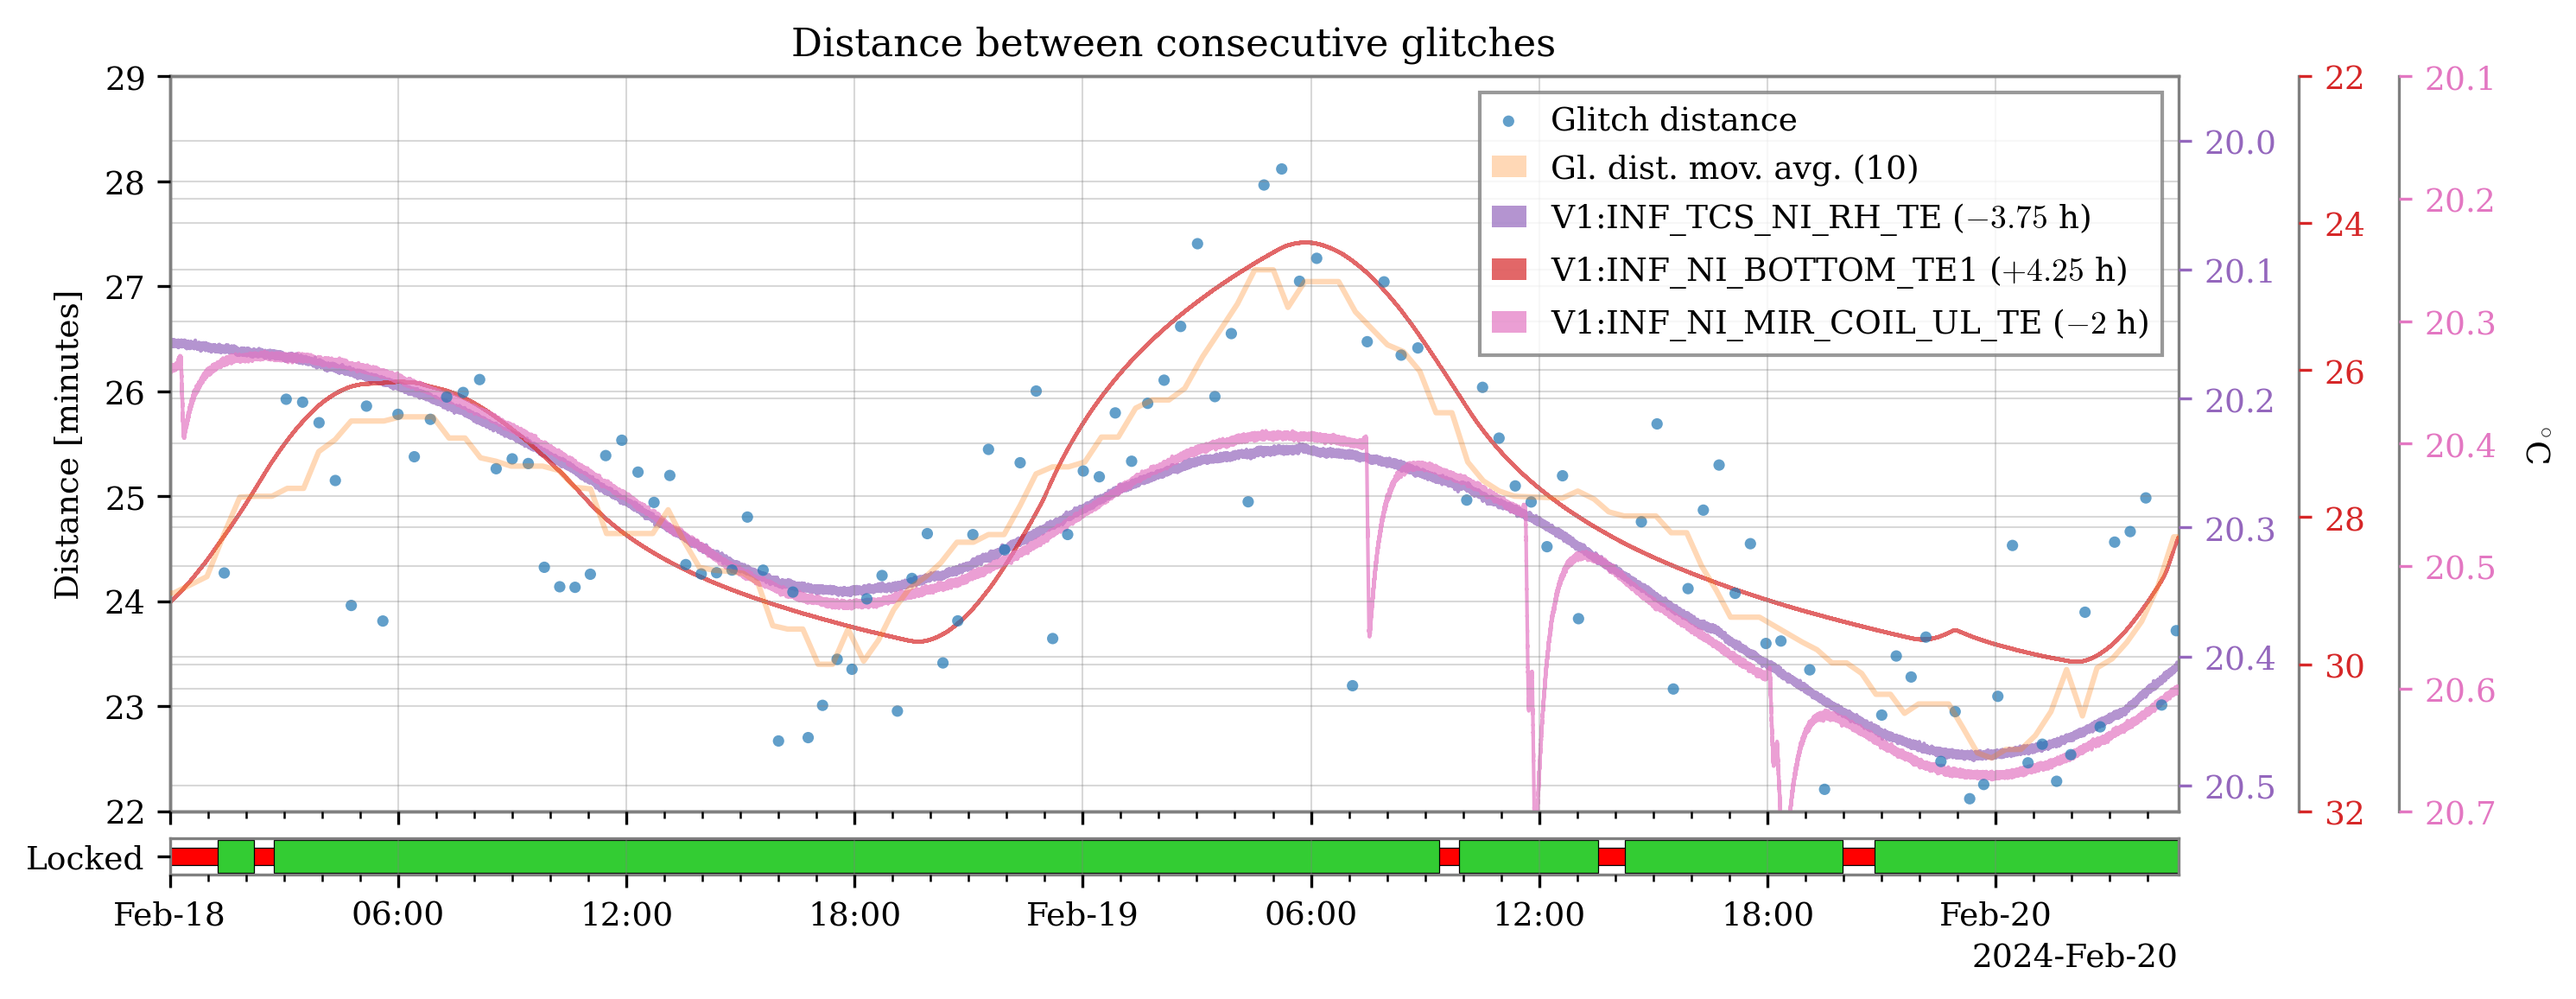
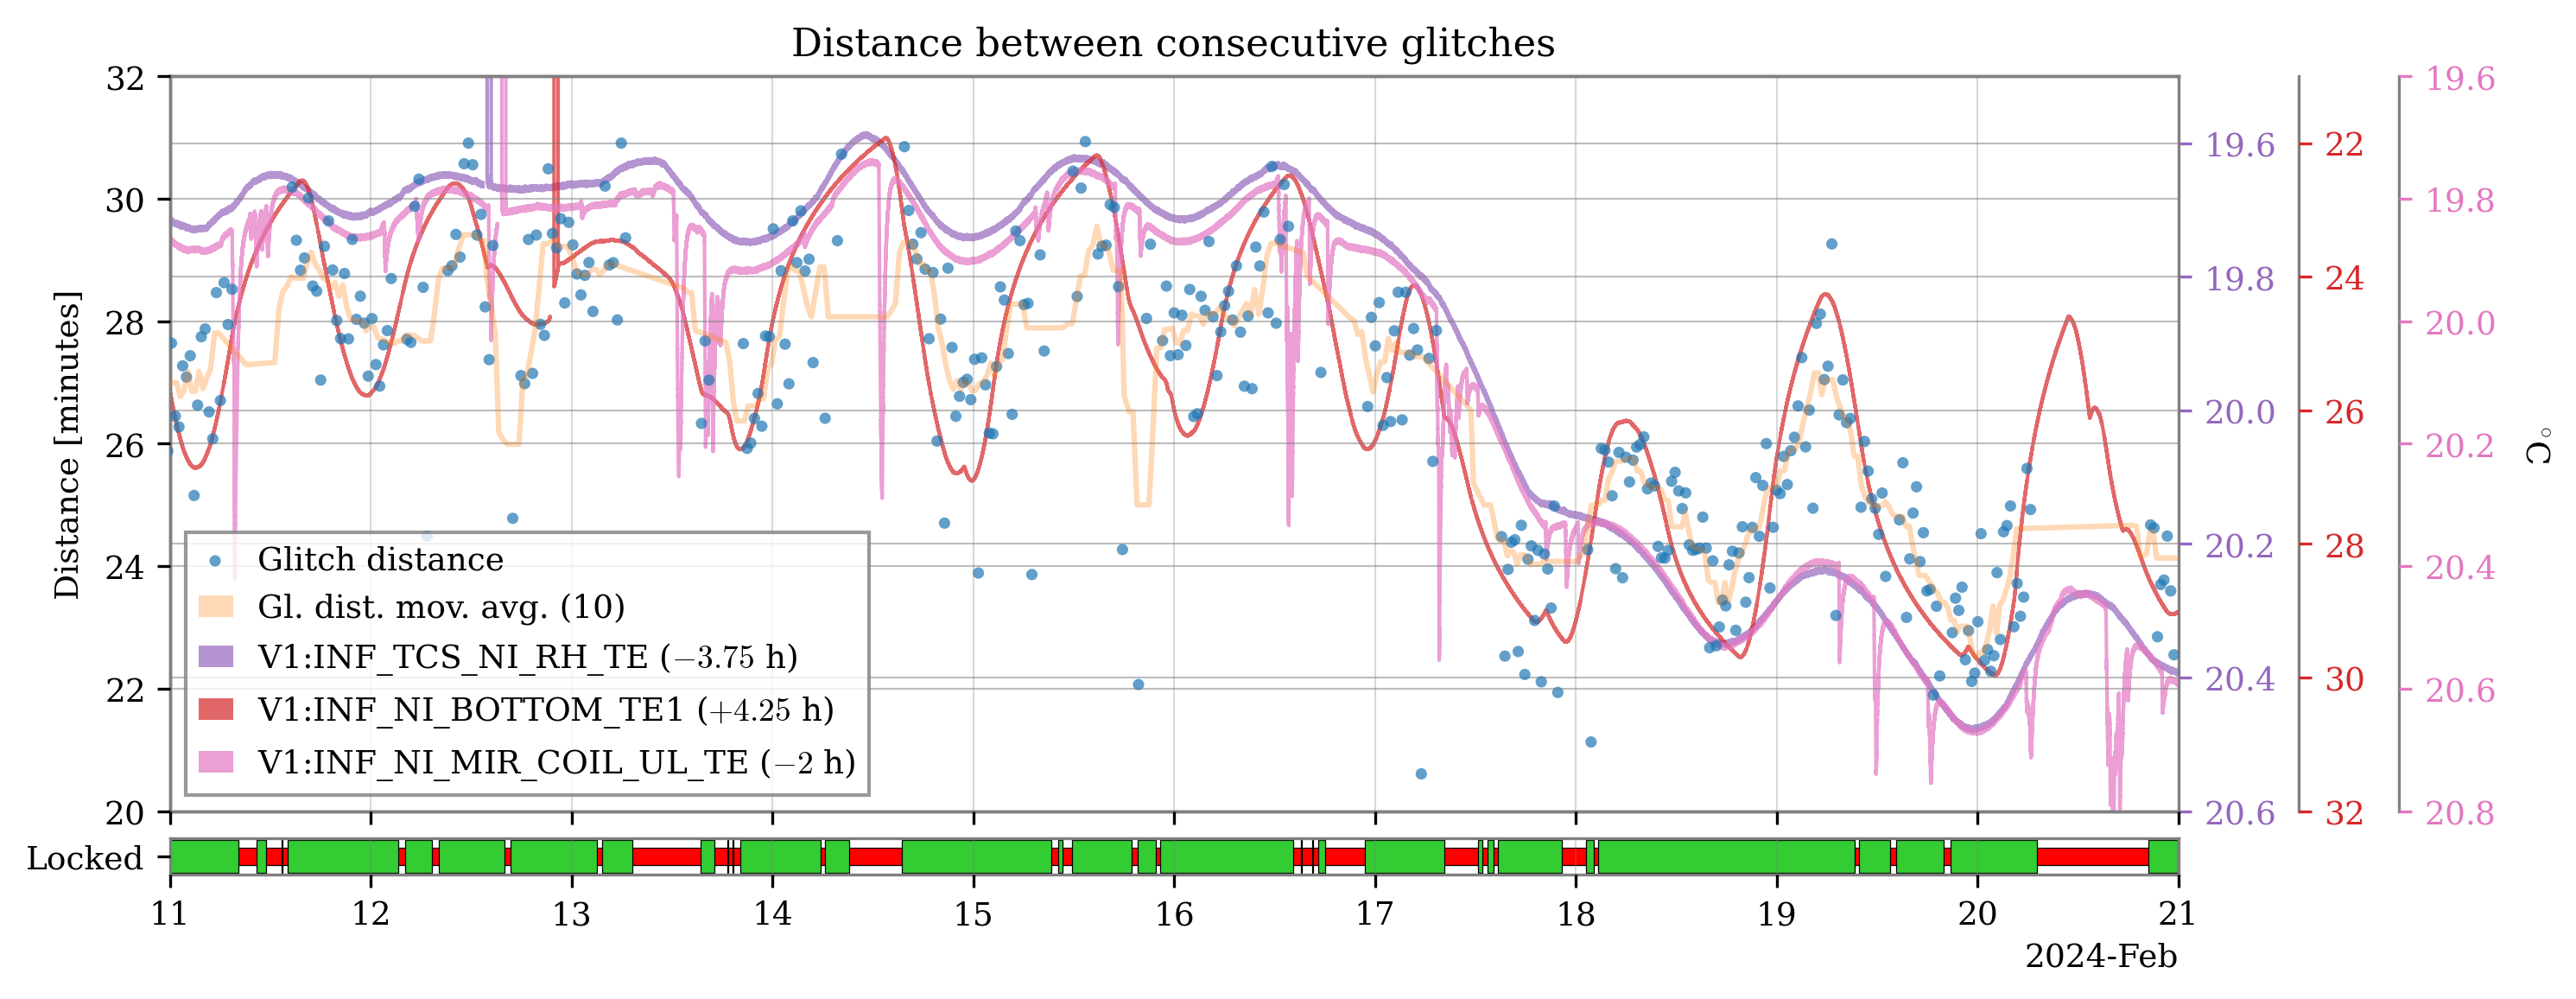
Figure 1: scatter plot of the omicron glitch trigger distance (same selection criteria described in #62965) together with three temperature sensors: V1:INF_TCS_NI_RH_TE (violet), V1:INF_NI_BOTTOM_TE1 (red), and V1:INF_NI_MIR_COIL_UL_TE (pink). There is also a transparent median curve but ignore it for the moment.
Figure 2: detail of the previous plot around the longest low noise segment. There is visible a delay between all the above quantities, likely due to different irradiation from the heating belts and the specific heat capacity of the various parts.
Figure 3: I tried to compensate for the delays by shifting the temperature time series. Just matching by eye the waves, it seems like the glitches follow the NI BOTTOM TE by 4h15, and anticipate the temperature variation in INF_NI_MIR_COIL_UL_TE by 2 hours, and INF_TCS_NI_RH_TE by 3h45.
Figure 4: the first figure with shifts applied. Indeed, with the 4h25 delay, the similarity of the glitches time series and V1:INF_NI_BOTTOM_TE1 is remarkable.
I tried a more analytic approach to estimate the delays finding the lags that minimize the cross-correlation function of the glitch distance with the other temperature time series. The delays found with this method are the following:
V1:INF_TCS_NI_RH_TE: +3:19:50 (the glitch rate changes before the temperature)
V1:INF_NI_BOTTOM_TE1: -4:01:20 (the glitch rate changes after the temperature)
V1:INF_NI_MIR_COIL_UL_TE: +0:48:50 (before)


It seems like a lot of thigs are going on in this small frequency interval just after the Ncal lines. To better understand the structures at around 42 Hz, we made several high resolution ASDs across January and February. The attached GIF image and the associated (static) PDF file describe the evolution of the line and bump structures over this period. This is a summary with some observations:
Jan 15: no line at 42 Hz but some structures are already visible at 42.4 Hz, as well as a small peak at 42.4 Hz. What I initially thought were sidebands of the 42 Hz line (ref. #63340) seem in fact to be not.
Jan 17: Another small peak at 41.65 Hz.
Jan 18: Increased noise baseline and new structure between 41.7 and 41.9 Hz.
Jan 19: The structure that just appeared seems to have moved to around 42 Hz. This structure appears to drift until Jan 22, as visible in this spectrogram.
Jan 20:: Sharper peak at 42 Hz.
Jan 21: New peak at 41.8 Hz, and structure centered at 42.1 Hz.
Jan 22 3:00: Peak at 42 Hz. This seems to come before the installation of the new chiller happened on Jan 23: #63062. The previous structure has now drifted to 42.2 Hz, and is different than the 42.4 Hz structure already documented.
Jan 22 11:40: the peak at 42 Hz is not visible but the structure at 42.2 Hz is now larger.
Jan 25: The 42 Hz peak is clearly visible. The structure at 42.2 Hz is either disappeared or merged with that at 42.4 Hz. The noise baseline is low.
Jan 26: Increased noise baseline.
Jan 27: The peak at 41.8 Hz is back...
Jan 28: ...and gone.
Feb 6: Increased peak at 41.6 Hz. The structure at 42.4 Hz seems wider.
Feb 9 and 11:New structure at 42.6? Is that part of what constituted the 42.4 Hz bump?
Feb 16: Dtructures at 41.4, 41.6, 42.4 and 42.6 Hz, in addition to the peak slightly before 42 Hz.
Feb 20: 42 Hz line disappeared after the chiller replacement: #63338. Structures at 41.4 Hz, 41.6 Hz, 42.4 Hz and slightly before 42.6 Hz are still visible but are likely not related to the 42 Hz line: they are no sidebands.
Some high resolution BruCo analysis should be done to understand the origin of the residual structures. The argument --medianpsdestimation , new to version 3.2, should provide handy to avoid the spectral estimations being spoiled by the 25-minute glitches. Additionally, this analysis proves that we need a tool that automatically performs periodic comparisons between spectra.

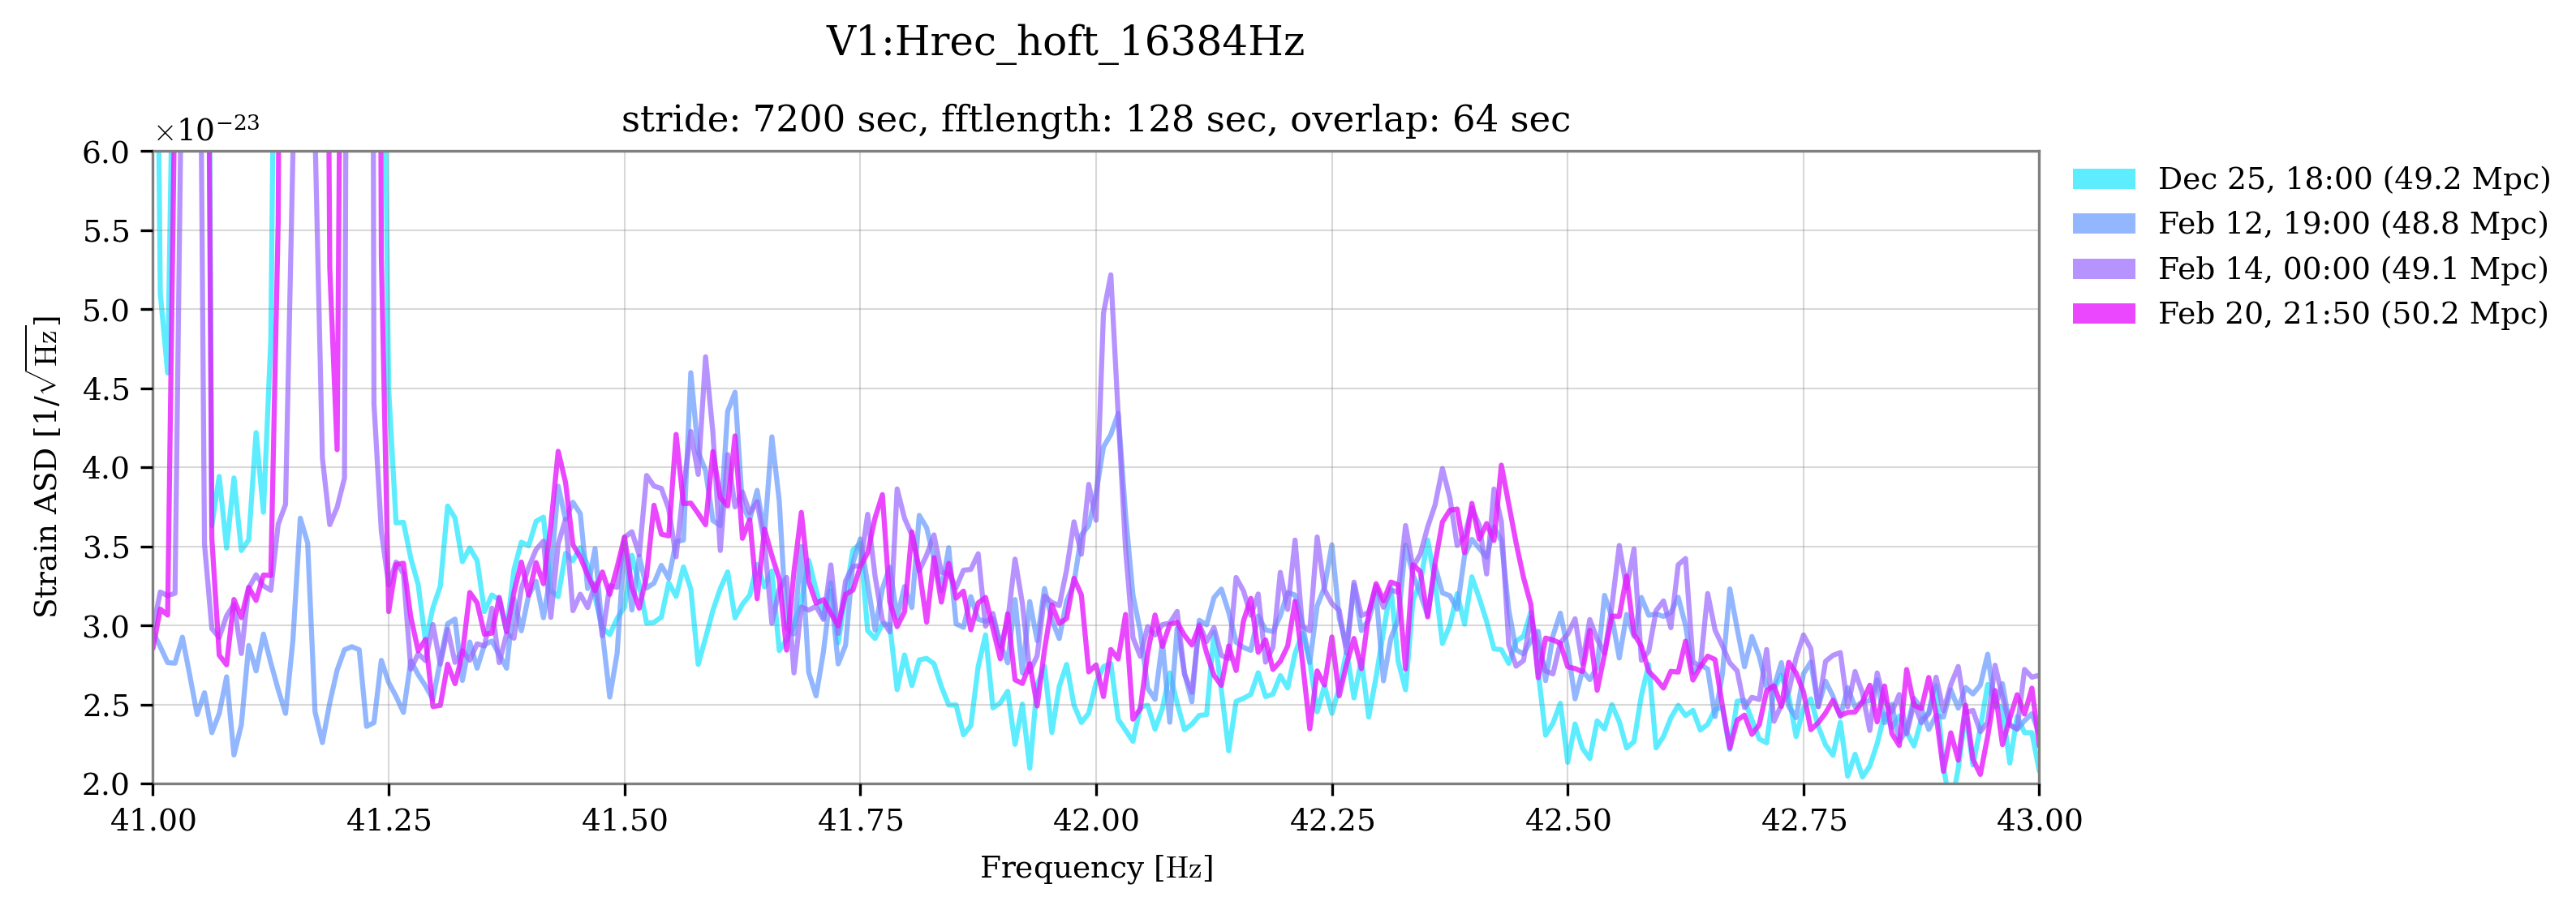
It seems that the chiller swap (#63338) removed the line at 42 Hz, as well as the comb of 1 Hz lines identified by BruCo and in the logbook entry #63339, but not the sideband structure at 400 mHz around the 42 Hz line.
Figure 1 shows the comparison of the ASDs estimated at four different times. Dec 25: no line at 42 Hz, small structure at 42.4 and probably nothing at 41.6 Hz. Feb 12: no Ncal lines but both the 42 Hz line and its sidebands are visible. Feb 14: Ncal on, 42 Hz line and sidebands visible. Feb 20: no 42 Hz line but the surrounding structure is still present.
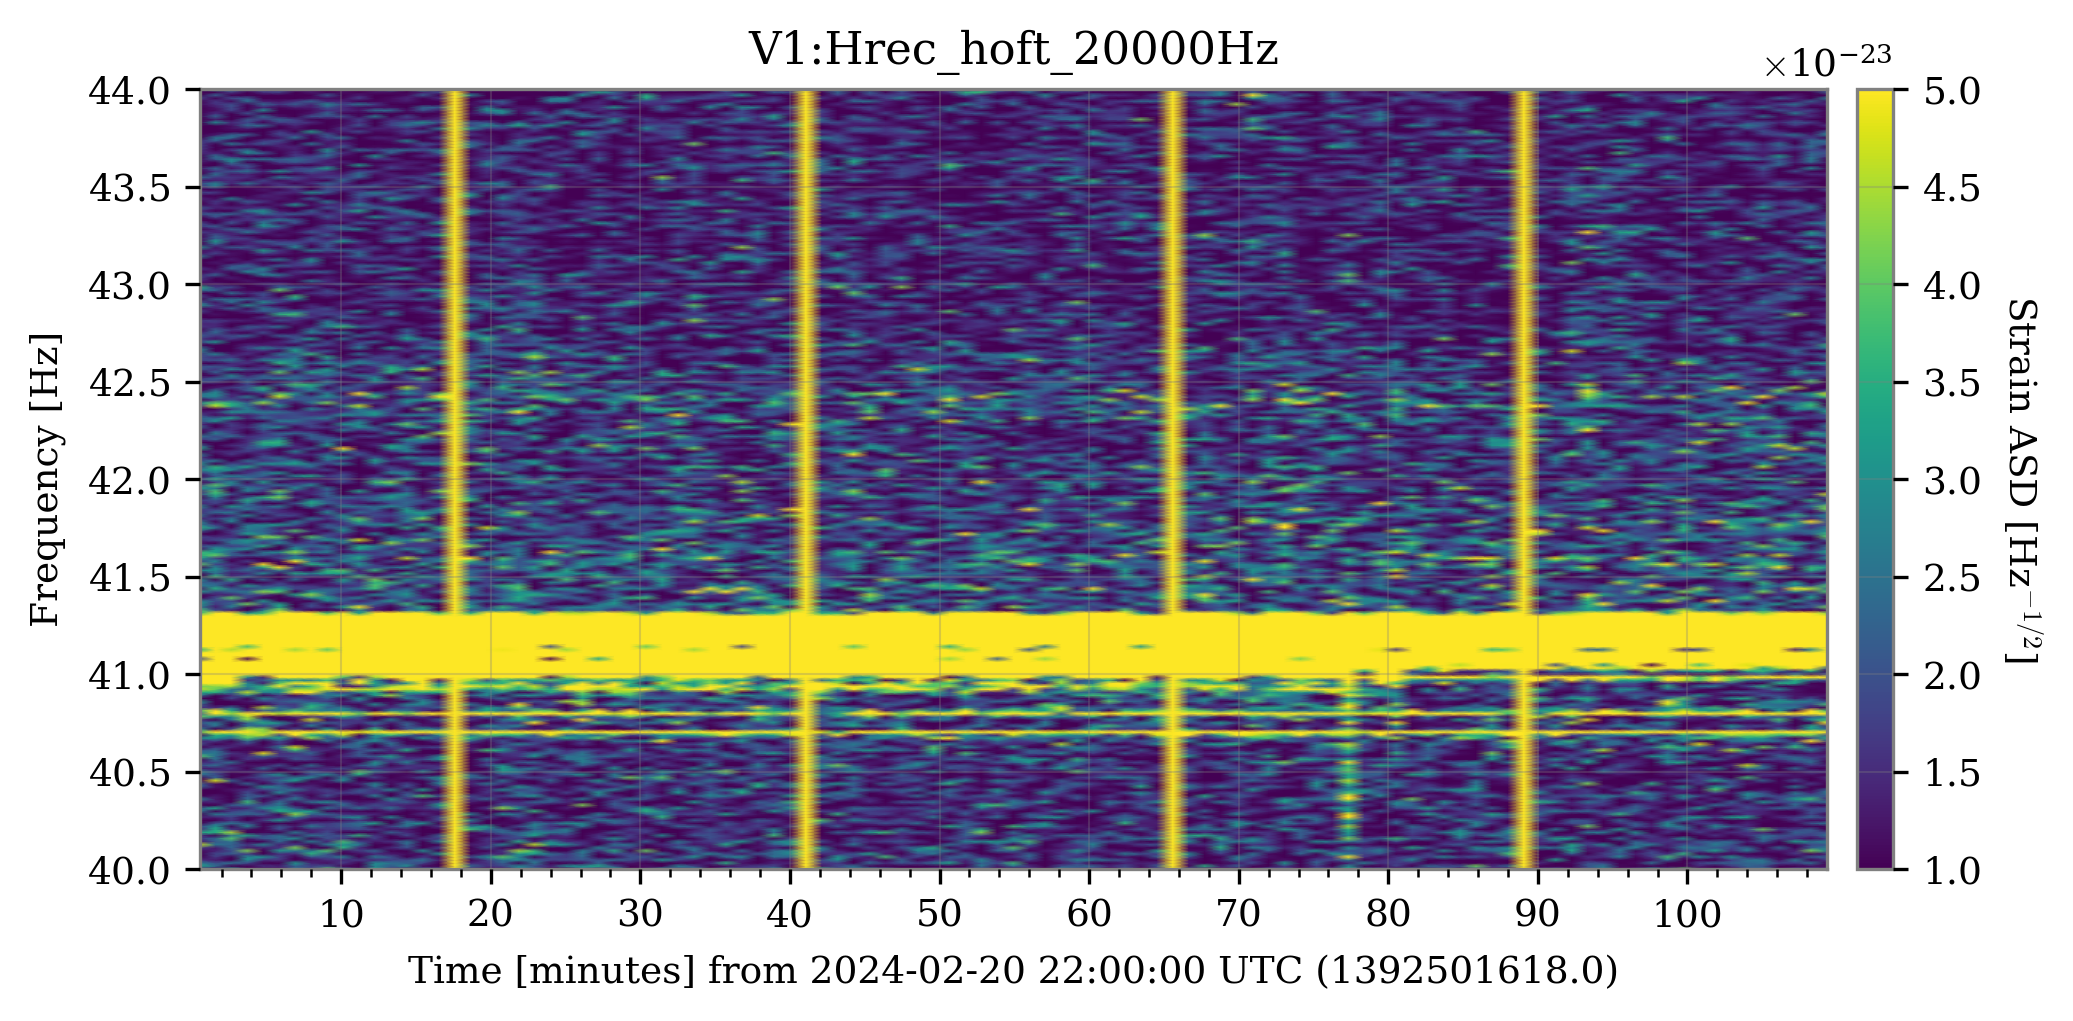
Figure 2: spectrogram of Hrec data from Feb 20 in the region around 42 Hz. The 42 line is not visible anymore but some excess of noise over the baseline is visible at ~42.4 Hz. The vertical yellow lines are the well known 25-minute glitches, while the horizontal lines between 40.5 and 41.5 Hz are the Ncal lines.
At this link, you can find the results of a BruCo run on the data from February 20, after the chiller swap. The coherence at 42 Hz is greatly diminished, as well as at the other integer frequencies between 30 and 49 Hz (the 50 Hz is excluded, of course).
To understand the origin of the structures around the 42 Hz line, I ran a bilinear noise coupling analysis with MONET on the data from February 12, using ENV_CEB_IPS_CURR_R as the carrier. The results are summarized in the attached text file and, partially, in Figure 3. The structures below 42 Hz are not well caught by the model and angular modulators used, with the possible exception of the structure around 41.8 Hz, predicted with Sc_NI_MIR_Y_AA as a modulator: Figure 4. The sideband at 42.4 Hz instead seems to be correlated with Sc_MC_MAR_TY_CORR as a modulator: Figure 5. Other interesting modulators, appearing all over the 42-43 Hz band are the Sc_IB_MAR_T{X,Y,Z}_CORR channels: Figures 6 and 7.


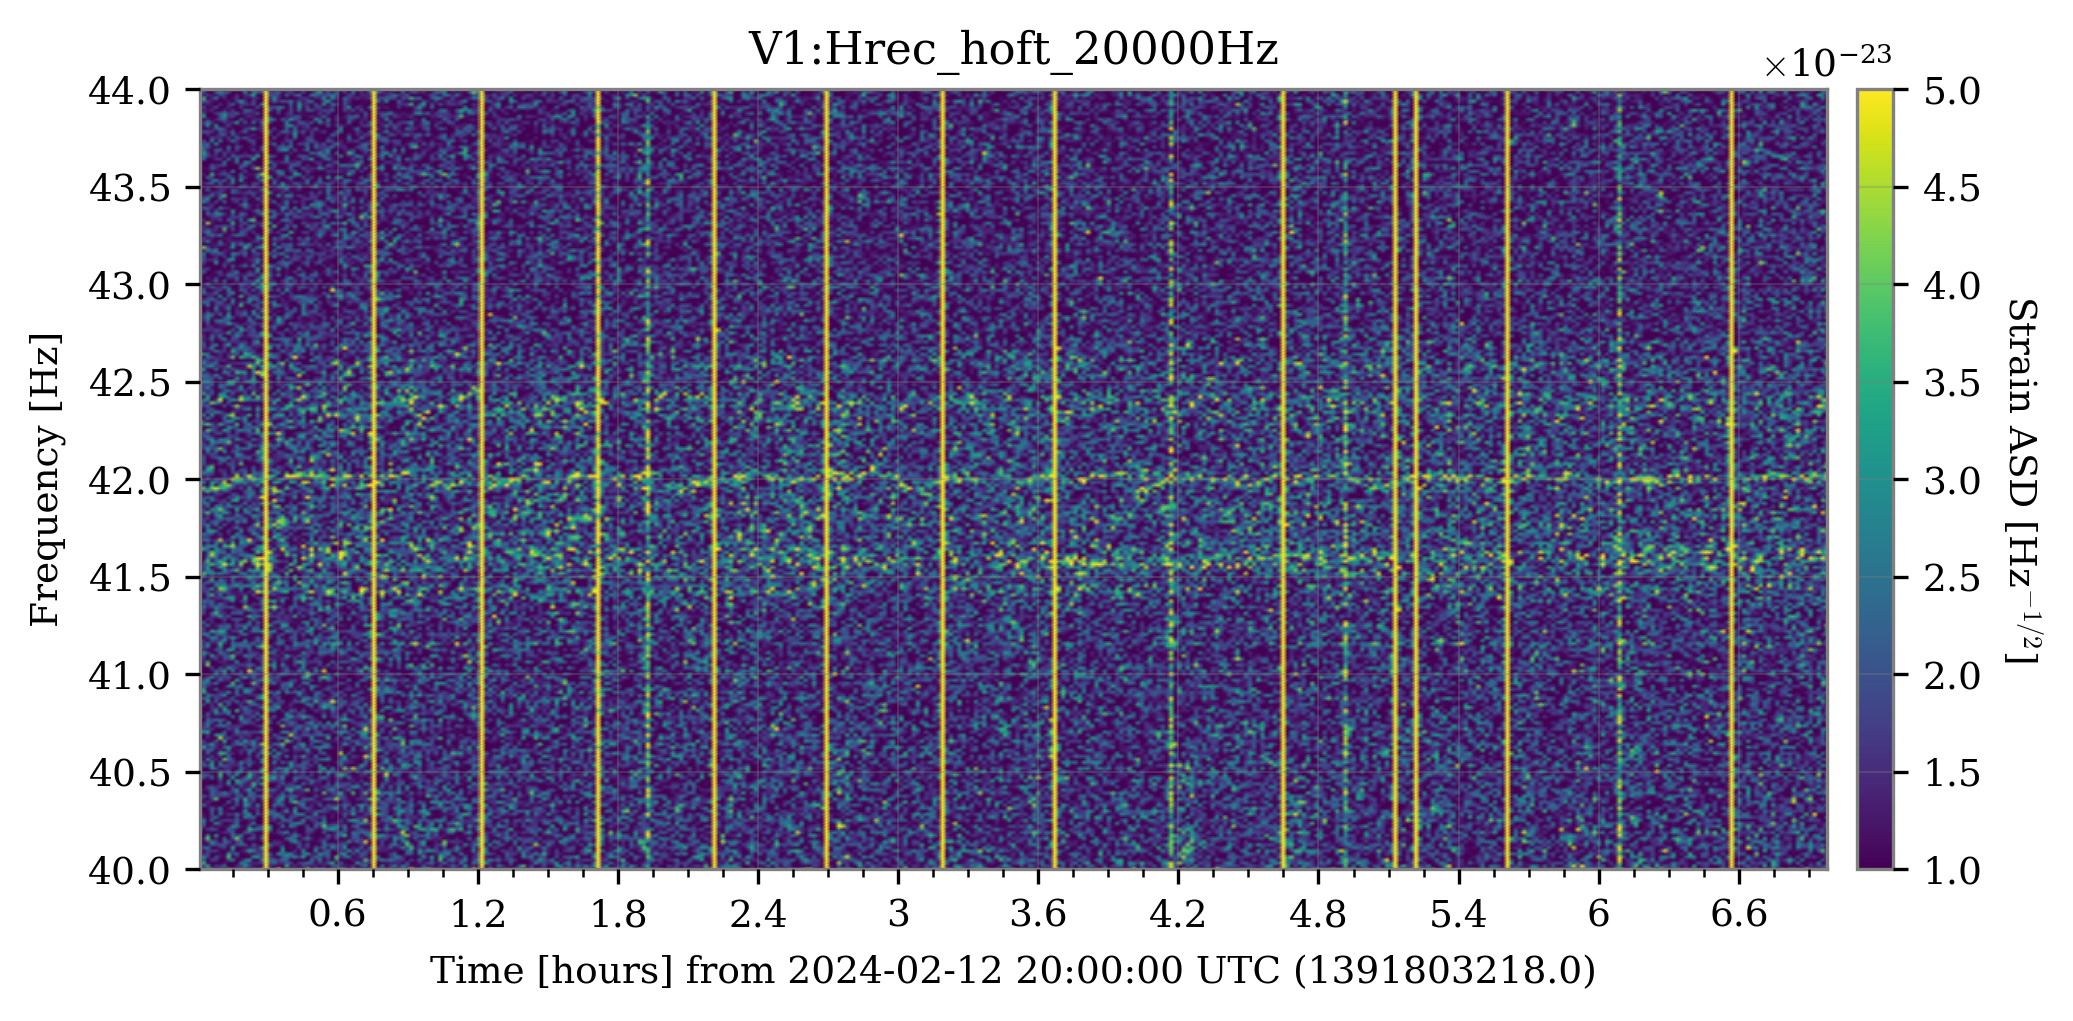
This spectral noise structure seems to be electric in origin. I have run a Bruco on the data from February 12 at 19:00 UTC: link to results. A non-negligible coherence is present at 42 Hz with ENV_CEB_{UPS,IPS}_{CURR,VOLT}_..., and with various magnetometers on the BS, DT, IB, etc. No coherence has been highlighted on the "sidebands" at +-400 mHz from 42 Hz. Interestingly, other small coherences are present at integer frequencies between ~30 and 50 Hz. These might be related to the noisy chiller described by Alain in this entry and its comments: #63274.
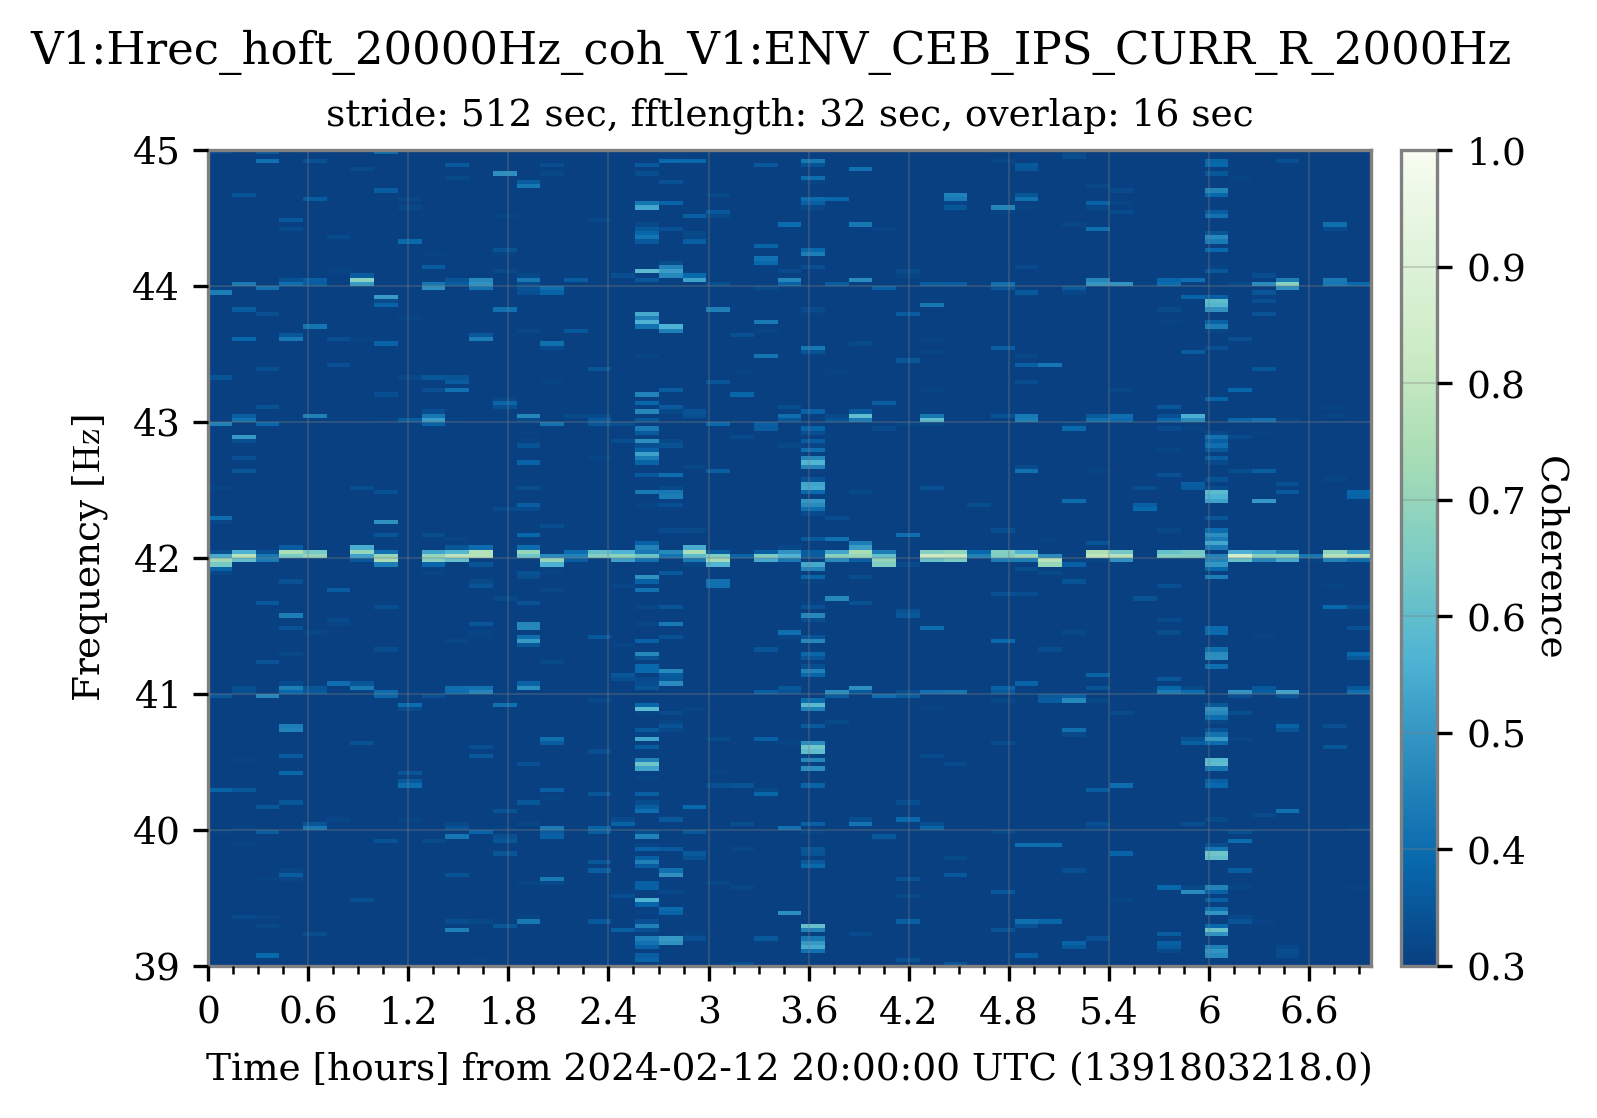
Figure 1: spectrogram of Hrec over 7 hours of data around the region of the 42 Hz structure. In fact, two sidebands are visible at approximately +-400 mHz. These may be due to some non-linear coupling, which is why they have not been caught by a coherence analysis. The 42 Hz line seems to move a little bit in frequency, as typical of the 50 Hz electric mains.
Figures 2 and 3 are coherence spectrograms between Hrec and ENV_CEB_IPS_CURR_R_2000Hz and ENV_BS_MAG_W, respectively. In these colormaps, some coherence is clearly visible at 42 Hz and, fainter, at 41, 43 and 44 Hz.
Figure 4: examining three different periods, Dec 25, Feb 12 (no Ncal), and Feb 14 (Ncal back), it seems that this excess noise at 42 Hz was not present during the mini-Engineering Run. Still, some structures are visible at 42.4 Hz (but not at 41.6 Hz). Concurrently, as shown by daily BruCo results for the ENV channels, no coherence with the above CURR and MAG channels was present during the days of the mini-Engineering Run at integer frequencies. This seems to confirm that the comb has appeared late (following the hint in #63274).


